CRM reporting has moved from a monthly admin task to a core growth system. Gartner says CRM sales software grew at 12.2% to $25.7 billion in 2024, and McKinsey reports that teams investing in AI are seeing 3 to 15 percent revenue uplift. Real implementations make the point even sharper: Salesforce says Avaya reduced reporting sprawl from 12,000 global reports to a mere 15 dashboards, while HubSpot’s Databox case study shows Revenue River achieved 50% less time on reporting.
At TechTide Solutions, we see the same pattern in custom CRM work: leaders do not need more raw data, they need cleaner definitions, tighter visibility, and reporting surfaces aligned to the decisions they actually make. When a CRM report is designed well, it becomes the operating layer for sales, marketing, service, and finance rather than a prettier replacement for a spreadsheet.
What CRM Reporting Is and Why It Matters
1. How CRM Reporting Turns Customer and Sales Data Into Insights
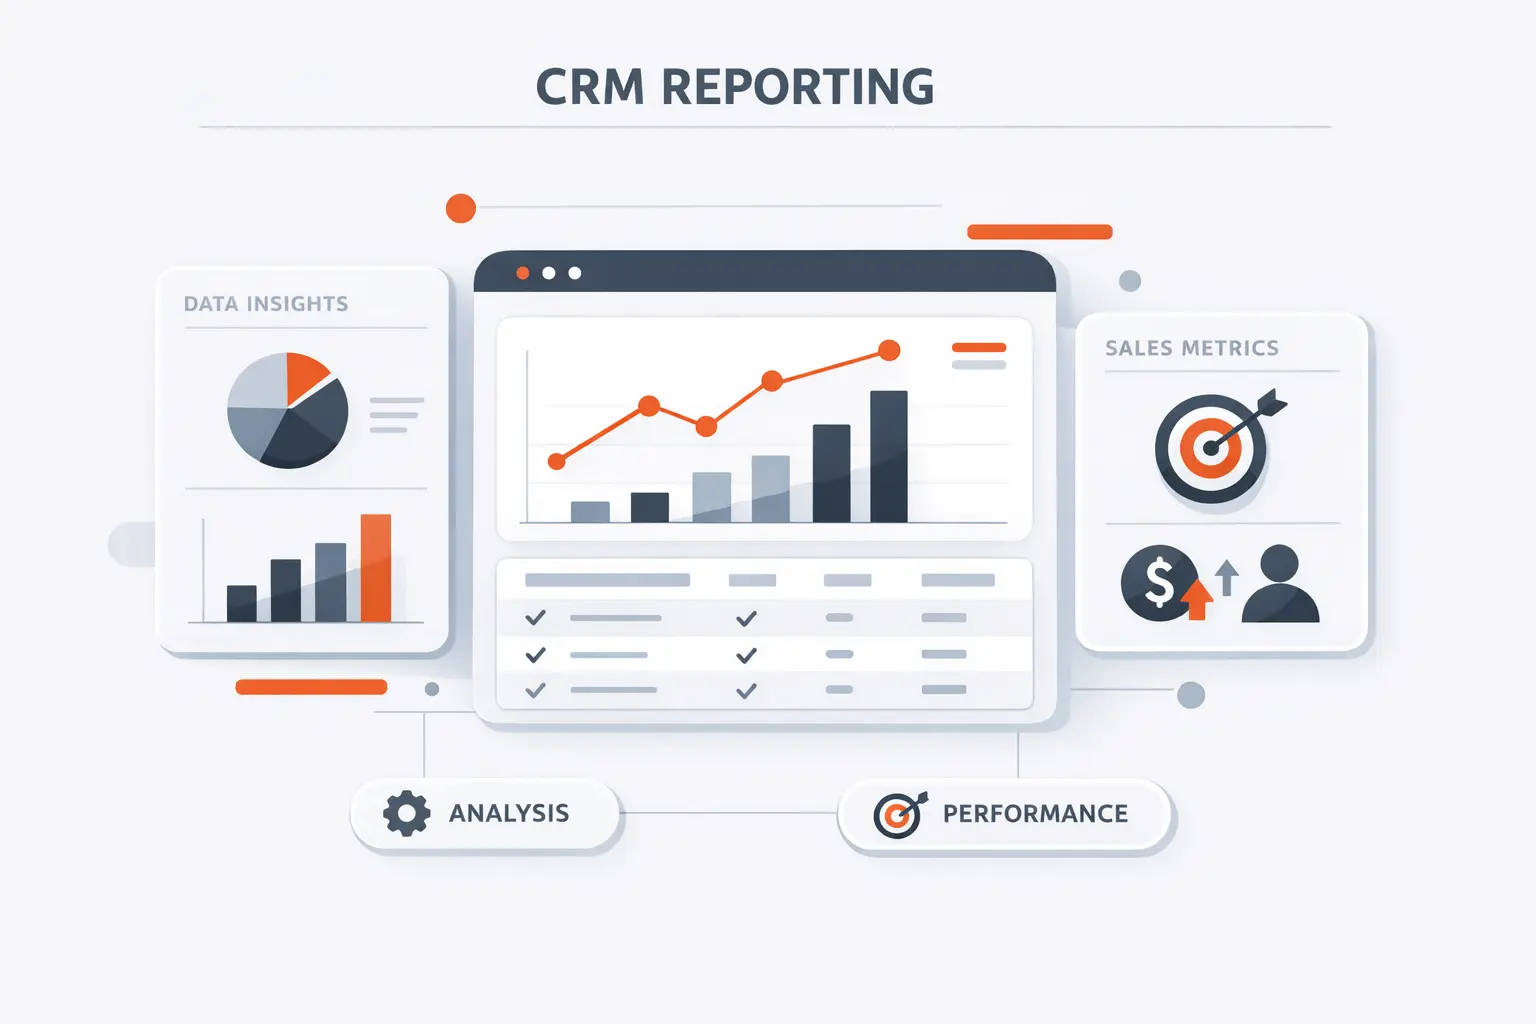
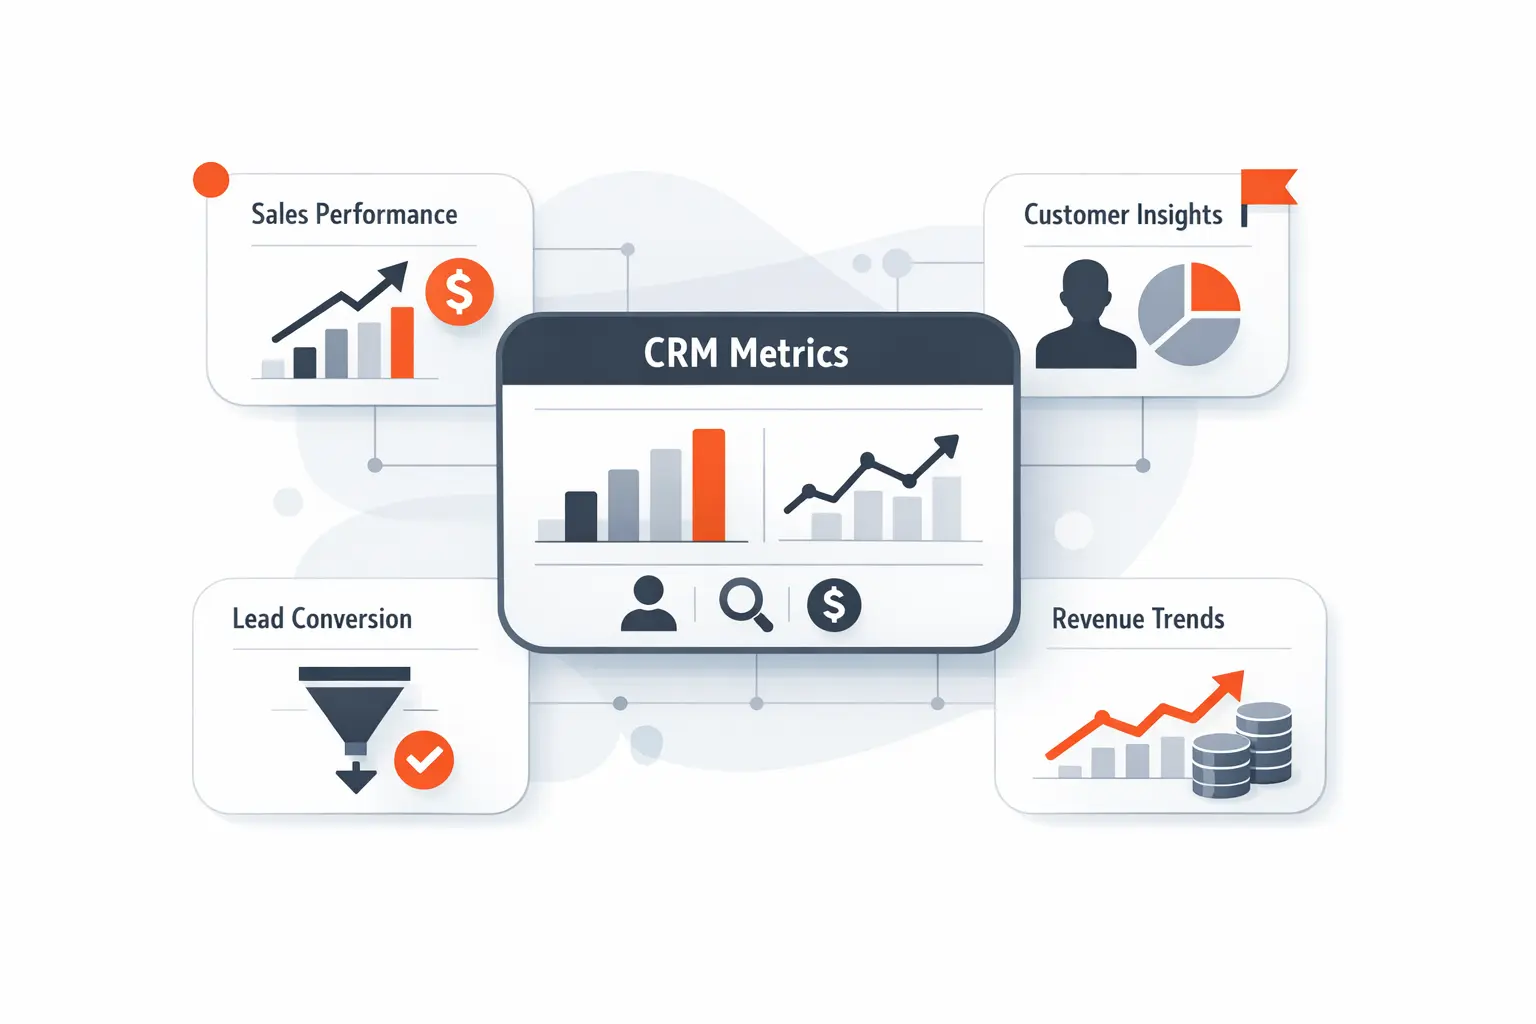
CRM reporting is the practice of turning CRM objects such as leads, opportunities, activities, tickets, and campaigns into reusable analytical views. Salesforce explicitly treats the report as the base layer that organizes and sorts data, while Zendesk frames dashboards as places where multiple reports are presented together. We agree with that model because it reflects sound architecture: structure the data first, then decide how to visualize it.
2. Why Visibility Improves Forecasting, Pipeline Health, and Planning
Visibility matters because forecasting breaks down when pipeline data is opaque. Microsoft’s sales documentation positions forecasts as tools for judging pipeline health and team performance against targets, and its dashboards surface open opportunities, pipeline phases, and estimated revenue in one place. In practice, that visibility helps us catch stage slippage, coverage gaps, and unrealistic close dates before they distort staffing, spend, and executive planning.
3. How CRM Reporting Supports Sales, Marketing, and Customer Support Teams
Sales wants pipeline truth, marketing wants attribution truth, and support wants case and satisfaction truth. HubSpot separates contact, deal, and revenue attribution reporting, while Salesforce and Zendesk both provide service-focused dashboards and satisfaction views. A mature CRM reporting model gives every function its own lens without letting each team invent its own metric definitions.
Recommended reading: Headless WordPress: A Practical Guide to Decoupled WordPress Architectures
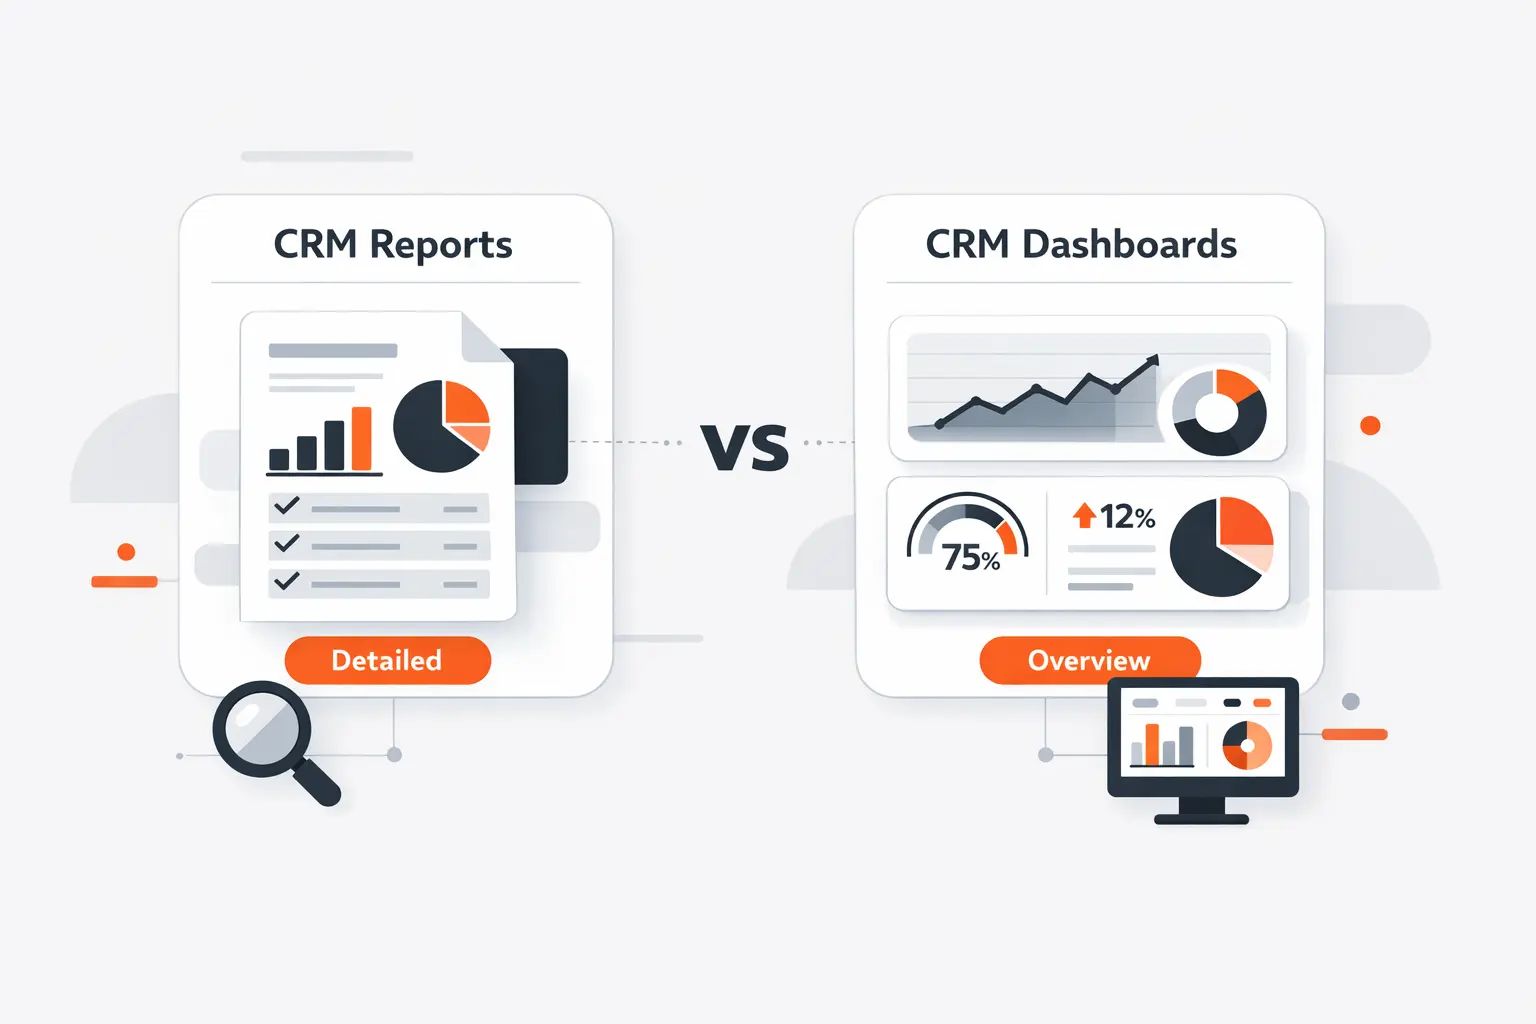
CRM Reports vs CRM Dashboards
1. When Reports Are Best for Detailed Analysis
When we need detailed analysis, reports are the right instrument because they preserve filters, groupings, formulas, and record-level drillback. HubSpot’s report builder exposes unsummarized datasets and export options, which is exactly what analysts need for root-cause work, segmentation, and auditability. A dashboard can point to an issue, but the underlying report is usually where the explanation lives.
2. When Dashboards Are Best for Real-Time Decisions
Dashboards are better for operational decisions because they compress multiple signals into a screen leaders can scan in seconds. Microsoft positions dashboards as a comprehensive view of actionable data, and Power BI adds threshold-based alerts when a tile crosses a limit. We like dashboards for standups, forecast calls, and support war rooms precisely because they reduce the cost of noticing change.
3. Why the Strongest CRM Reporting Strategy Uses Both
The strongest CRM reporting strategy uses both: reports answer why, while dashboards answer what needs attention now. Salesforce’s own admin guidance says you build the report before the dashboard, and Zendesk makes the same structural distinction between a single report and a multi-report dashboard. We treat that pairing as non-negotiable because teams need analytical depth and executive speed at the same time.
Recommended reading: Umbraco vs WordPress: A Practical CMS Comparison for Businesses and Developers
Core Benefits of CRM Reporting
1. More Accurate Revenue Forecasting and Goal Tracking
Revenue forecasting improves when pipeline stages, categories, and goals live inside the same reporting system. Microsoft’s forecast tools and HubSpot’s forecast workspace both emphasize using pipeline data to track progress against targets and support manager coaching. From our perspective, the win is not just a better final number; it is earlier intervention while deals can still be influenced.
2. Faster Decisions With Clearer Pipeline and Activity Visibility
Clear pipeline and activity visibility shortens decision latency. Salesforce’s sample dashboards highlight opportunity stage, expected revenue, case trends, and resolution performance, while Microsoft’s sales dashboards keep open opportunities and leads in plain view. Once those views are shared consistently, managers stop hunting through records and start acting on stalled deals, missed follow-ups, and workload imbalances.
3. Better Coaching, Efficiency, and Customer Experience
Better reporting also changes behavior. Managers can coach around activity quality instead of raw volume, marketers can retire channels that create noise without revenue, and service leaders can connect case load to satisfaction patterns. We have found that teams become more efficient when reporting is embedded in the workflow rather than delivered as a detached monthly packet.
Recommended reading: What Is Jetpack WordPress? Complete Guide to Features, WordPress.com Connection, and Setup
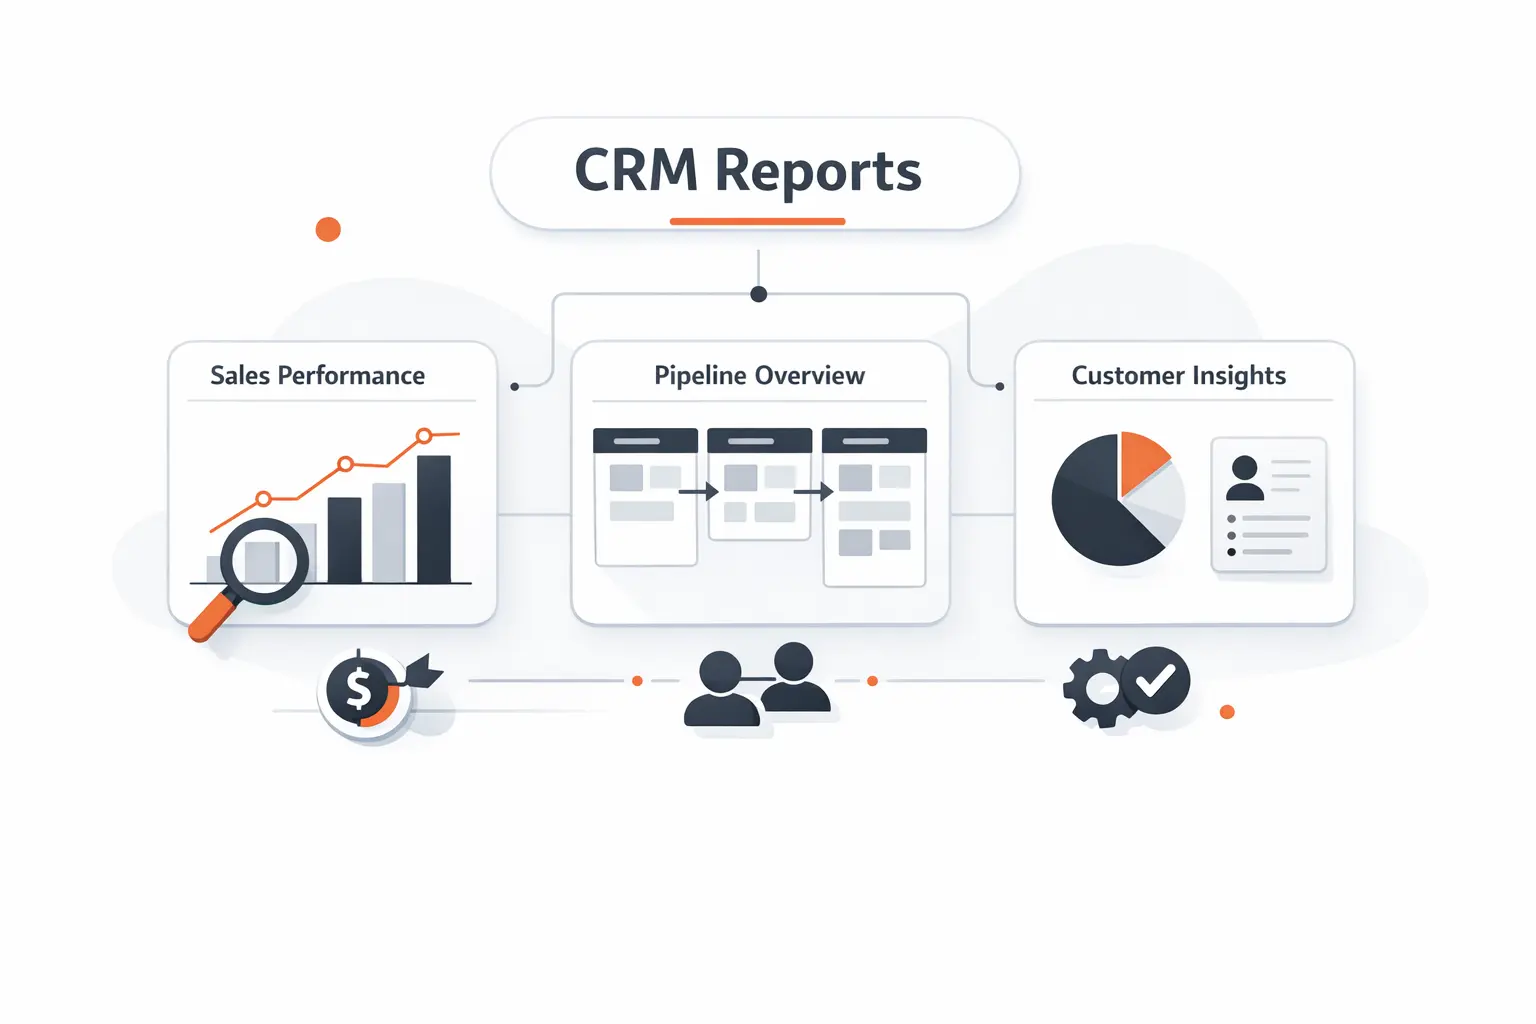
Essential CRM Reports Every Team Should Track
1. Pipeline Health, Funnel, and Sales Forecast Reports
Every sales team should start with pipeline health, funnel, and forecast reports. We typically combine stage distribution, pipeline aging, close-date slippage, weighted revenue, and coverage by owner so leaders can see whether volume and quality are aligned. Microsoft and Salesforce both surface pipeline stages and forecast views as core sales reporting assets, which tells us this is still the foundation.
2. Lead Source, Conversion, and Revenue Attribution Reports
Lead source, conversion, and revenue attribution reports answer the question many teams avoid: which acquisition motions actually create revenue, not just inquiries. HubSpot separates contact creation, deal creation, and revenue attribution for precisely this reason. We recommend aligning source reports with standardized campaign naming and lifecycle definitions, or attribution will look precise while remaining operationally misleading.
3. Sales Activity, Sales Cycle, and Win Loss Reports
Sales activity, sales cycle, and win-loss reports reveal whether the motion itself is healthy. Calls, meetings, emails, response times, stage duration, and closed-lost reasons expose friction that topline totals hide. In our work, these reports become especially valuable when they are segmented by market, rep, product, and source so coaching reflects context rather than averages.
4. Profitability, Goal Progress, and Team Performance Reports
Profitability, goal progress, and team performance reports matter when CRM data is joined with line items, recurring revenue, or finance signals. HubSpot’s revenue reporting explicitly tracks upgrades, downgrades, renewals, and churn-related revenue movement, which is the right direction for any business with subscription or services economics. We like pairing that with quota attainment and contribution views so growth is measured for quality, not only for volume.
5. Customer Service, Satisfaction, and Retention Reports
Customer service, satisfaction, and retention reports belong in the same conversation because service data often predicts commercial outcomes before finance does. Salesforce’s service dashboards track cases, distribution, and resolution patterns; Zendesk and HubSpot both expose satisfaction reporting; and recurring-revenue views can show the commercial effect of churn. When these signals sit together, support stops being a cost center in the reporting model and starts becoming an early-warning system.
Recommended reading: inmotion vs hostgator: InMotion Hosting vs HostGator Comparison
Key Metrics That Strengthen CRM Reporting
1. Lead to Opportunity Conversion Rate
Lead-to-opportunity conversion rate is one of the cleanest measures of lead quality and follow-through. We calculate it using tightly defined lifecycle transitions and a consistent measurement window, then segment it by source, campaign, market, and owner. If the rate drops, the root cause may sit in targeting, handoff discipline, data hygiene, or qualification criteria rather than in pure lead volume.
2. Average Deal Size and Sales Cycle Length
Average deal size and sales cycle length should always be analyzed together. Larger deals often carry longer cycles, so isolated averages can push teams toward the wrong conclusion about performance. We prefer slicing these metrics by segment, product line, and source because that exposes whether an extended cycle reflects enterprise complexity, weak qualification, or avoidable process drag.
3. Forecast vs Actual Revenue
Forecast-versus-actual revenue is where CRM reporting meets executive credibility. We advise tracking the gap by rep, manager, pipeline, and forecast category so teams can see where optimism or caution consistently enters the system. Over time, this metric improves not only forecast quality but also deal inspection, coaching, and investment planning.
4. Churn, Retention, and Customer Satisfaction Trends
Churn, retention, and customer satisfaction trends become far more useful when viewed as a sequence rather than as isolated snapshots. We look for rising case load, slower resolution, worsening sentiment, downgrade patterns, and lost recurring revenue in the same reporting window. That combination gives operators a better read on customer health than any single retention metric ever could.
Recommended reading: WordPress vs Custom CMS: How to Choose the Right Platform for Your Website
How to Build a CRM Reporting Strategy
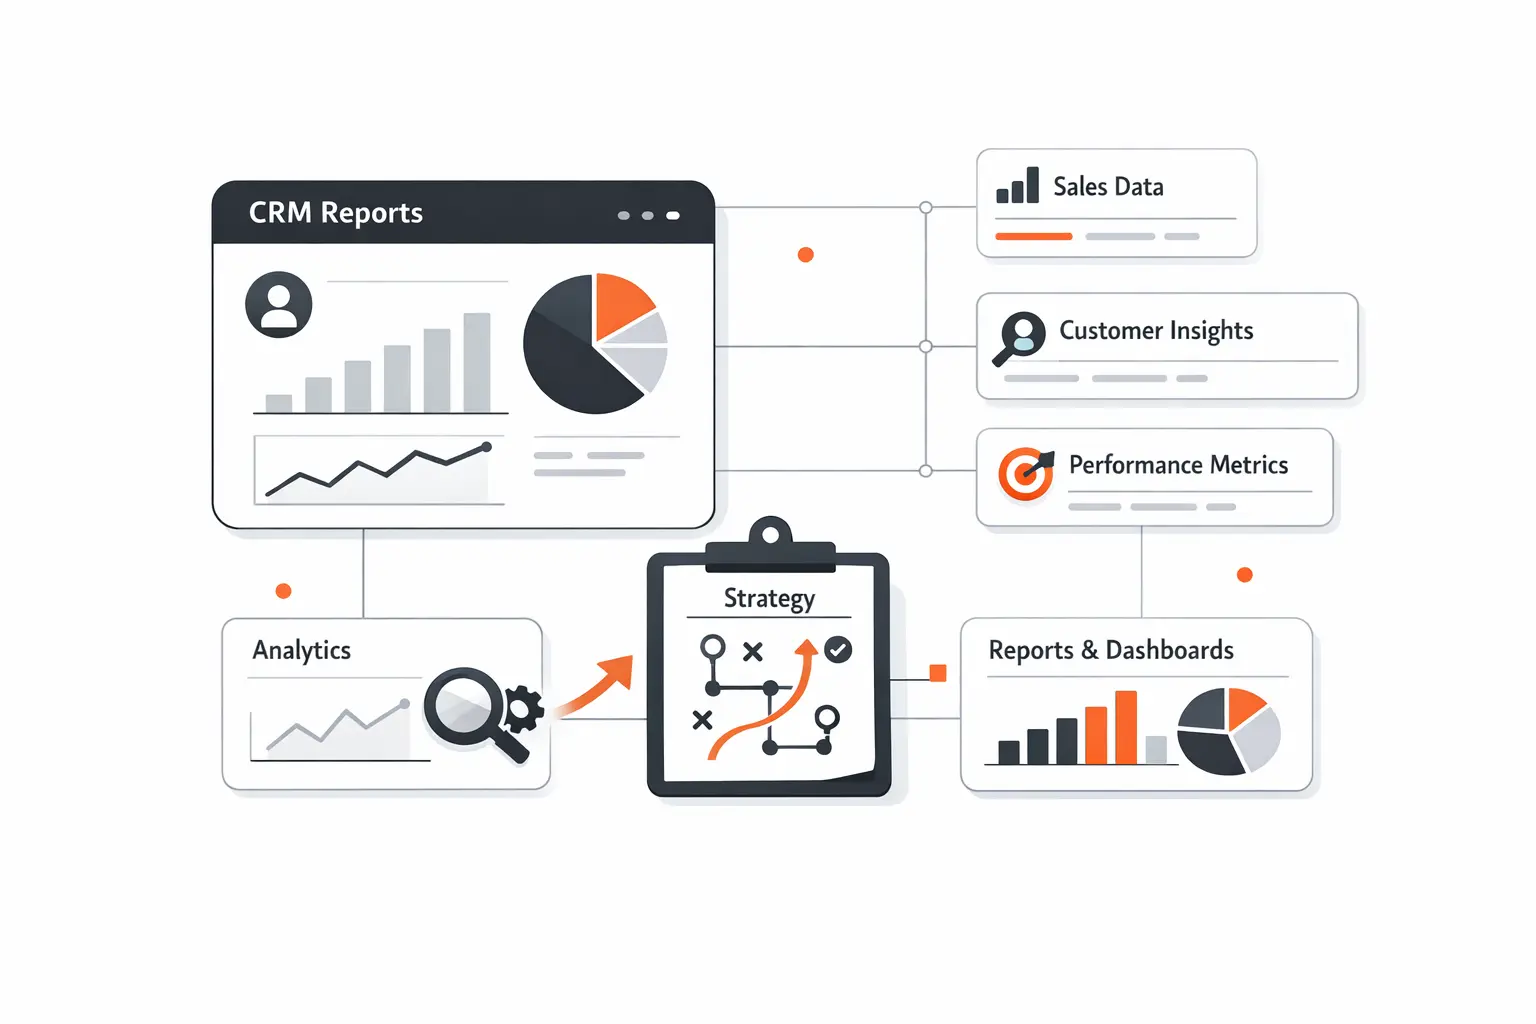
1. Start With Business Goals, KPIs, and Audience Needs
A strong CRM reporting strategy starts with business goals, the KPIs that express those goals, and the audience that must act on them. Salesforce explicitly recommends asking what the organization’s KPIs are, how the data will be used, and who should view it before building a dashboard. We follow the same sequence because reporting designed without an audience usually becomes either decorative or ignored.
2. Clean and Standardize Your Data Before Building Reports
Clean and standardized data is the hidden prerequisite. Duplicate records, inconsistent stage names, empty ownership fields, and mismatched date logic will contaminate every downstream metric, no matter how beautiful the dashboard looks. HubSpot’s data quality digest and Microsoft Dataverse duplicate-detection tools both underline the same principle we repeat to clients: fix the data model before you celebrate the chart.
3. Use Prebuilt Reports, Custom Reports, and Automation Wisely
Prebuilt reports are excellent for speed, custom reports are essential when you need cross-object logic, and automation should eliminate repetitive assembly work rather than hide questionable definitions. HubSpot’s reporting stack spans attribution reports, custom report builders, and scheduled dashboard distribution, which is a useful reminder that modern CRM reporting is part configuration discipline and part workflow design. We usually start simple, validate trust, and then automate refresh and delivery paths.
4. Share Reports With the Right Teams and Improve Them Over Time
Sharing is not an afterthought; it is part of the reporting design. HubSpot lets teams distribute reports and dashboards on a recurring basis, while Salesforce and HubSpot both support audience-specific visibility through folders, dashboard access rules, and viewer-based experiences. We review report usage, retire stale assets, and revise metric logic over time because good reporting is a living product, not a one-time deliverable.
What a Good CRM Report Looks Like
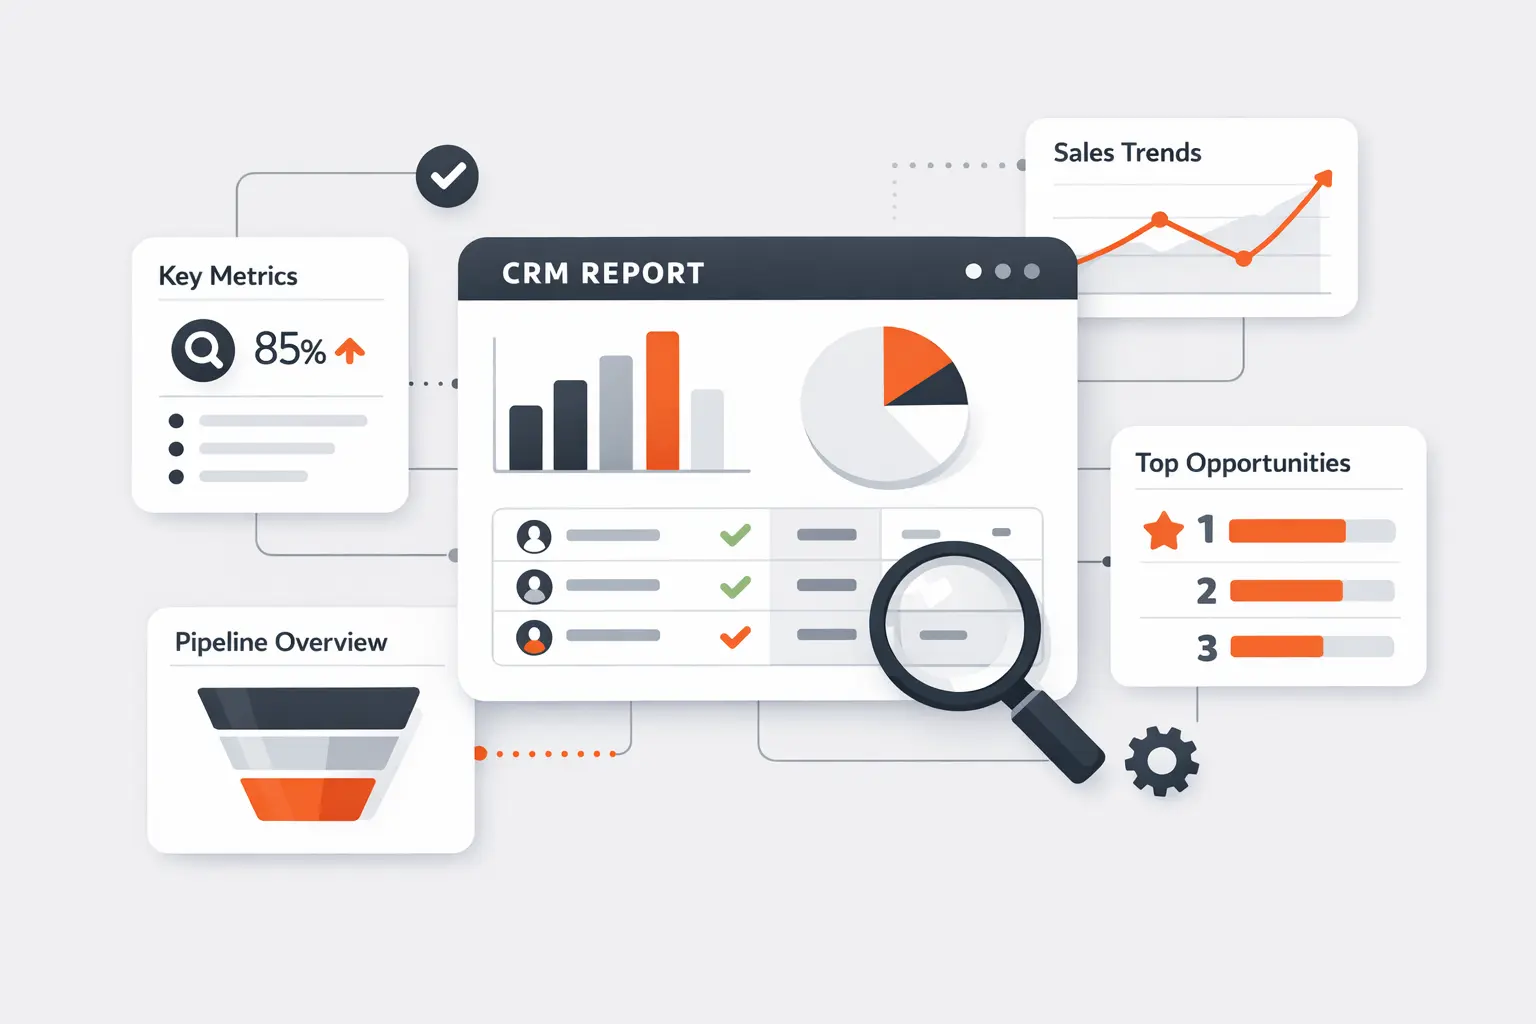
1. Focused Metrics and a Clear Story
A good CRM report stays focused on a small set of related metrics and tells a story the reader can act on. Revenue River’s case is a useful reminder that reporting becomes valuable when it highlights the metrics that actually drive growth rather than vanity indicators. We aim for every report to answer a specific operational question, name the time context, and make the next decision easier.
2. Visuals, Drill-Down Views, and Easy Analysis
Visual design should reduce cognitive load, not decorate it. Salesforce’s dashboard guidance emphasizes drill-down behavior, scoped filters, and targeted chart choices, and HubSpot’s mobile dashboard experience also supports drilling into KPI-backed records. We prefer visuals that reveal variance quickly and then let users descend into the underlying records without leaving the workflow.
3. Role-Based Dashboards, Alerts, and Mobile Access
Role-based dashboards, alerts, and mobile access are what turn reporting into an operational habit. Salesforce dynamic dashboards tailor views to viewer permissions, Power BI lets teams set data alerts on key tiles, and HubSpot supports mobile dashboard review with AI-assisted insights. In our view, accessibility is not a convenience feature; it is the difference between a report people consult occasionally and a system they trust daily.
How AI and Automation Improve CRM Reporting
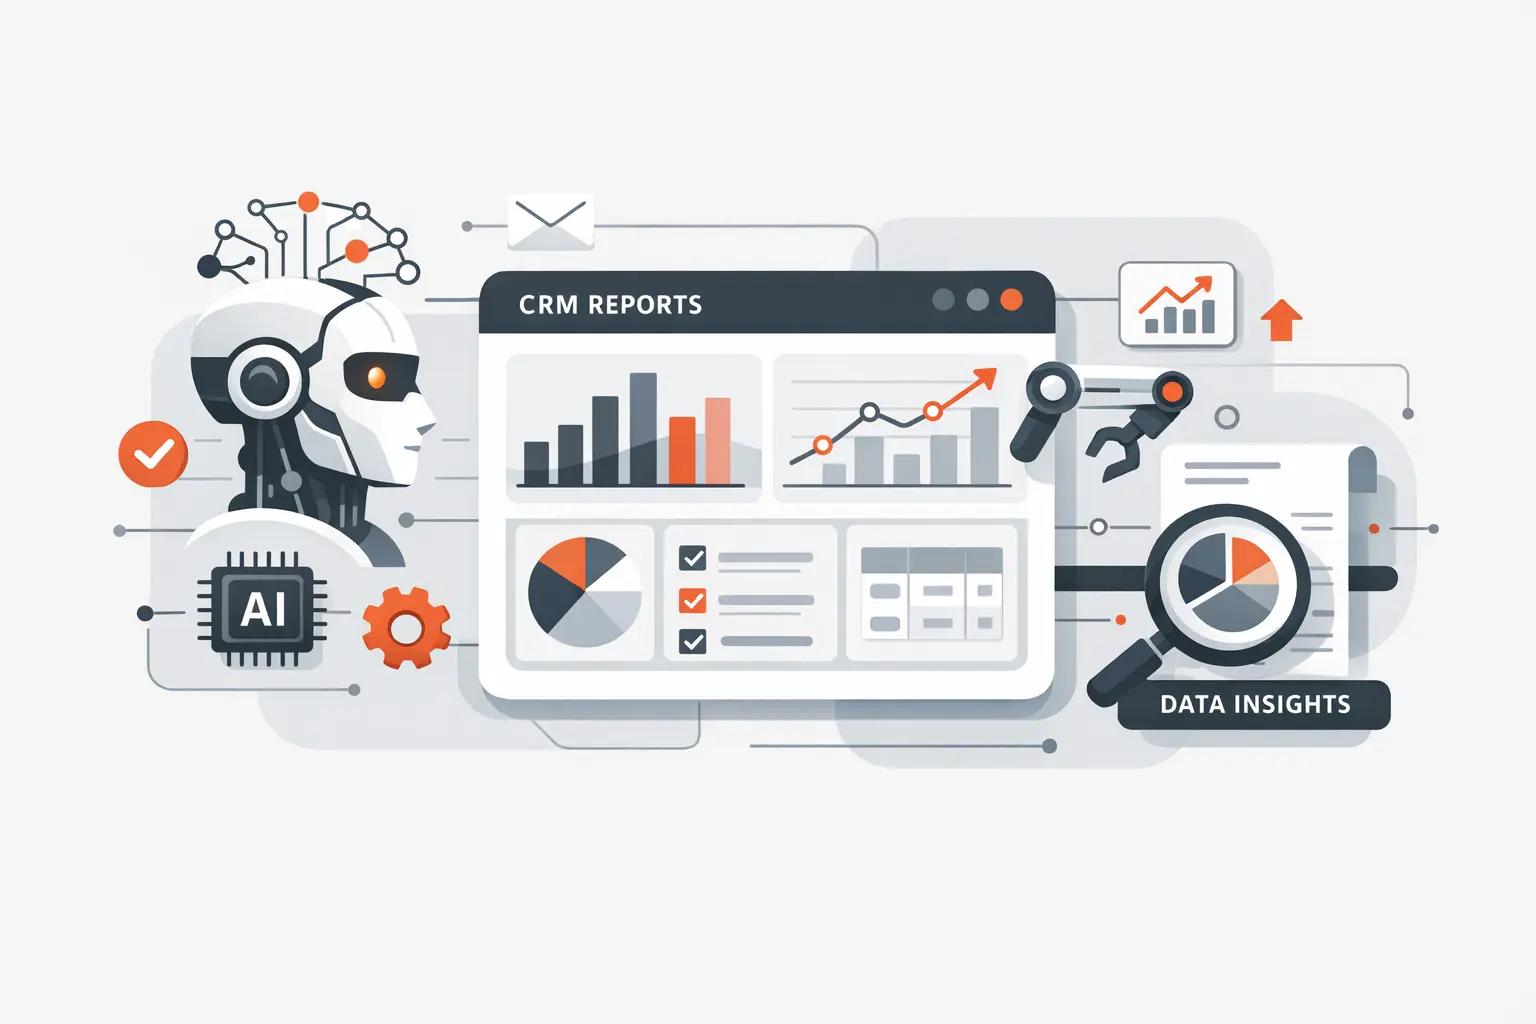
1. Automatic Data Collection Across Your Revenue Stack
Automatic data collection across the revenue stack matters because manual exports break lineage, slow refresh, and introduce reconciliation errors. The Revenue River example shows the upside of combining CRM and other go-to-market sources into shared reporting instead of copy-and-paste reporting, and HubSpot’s custom reporting model is built around unified object data. We usually extend that idea further by pulling in billing, product usage, and support events so CRM metrics reflect the full customer lifecycle.
2. Predictive Forecasting and Pattern Recognition
Predictive forecasting is where AI becomes materially useful. McKinsey’s research on marketing and sales performance points to measurable uplift from AI investment, while Avaya’s Salesforce implementation shows how embedded analytics can help sellers prioritize opportunities and improve forecasting behavior. We believe the real advantage comes when models are trained on stage history, activity signals, seasonality, and account context rather than on pipeline amount alone.
3. Scheduled Delivery, Self-Service Access, and Real-Time Alerts
Scheduled delivery, self-service access, and real-time alerts close the loop between analysis and action. HubSpot supports recurring distribution of reports and dashboards, Power BI supports threshold alerts, and Avaya’s case illustrates the cultural shift that happens when analytics are embedded for broad self-service rather than reserved for specialist analysts. That is the pattern we chase: insight arriving in the flow of work, not waiting in a forgotten folder.
Common CRM Reporting Mistakes to Avoid
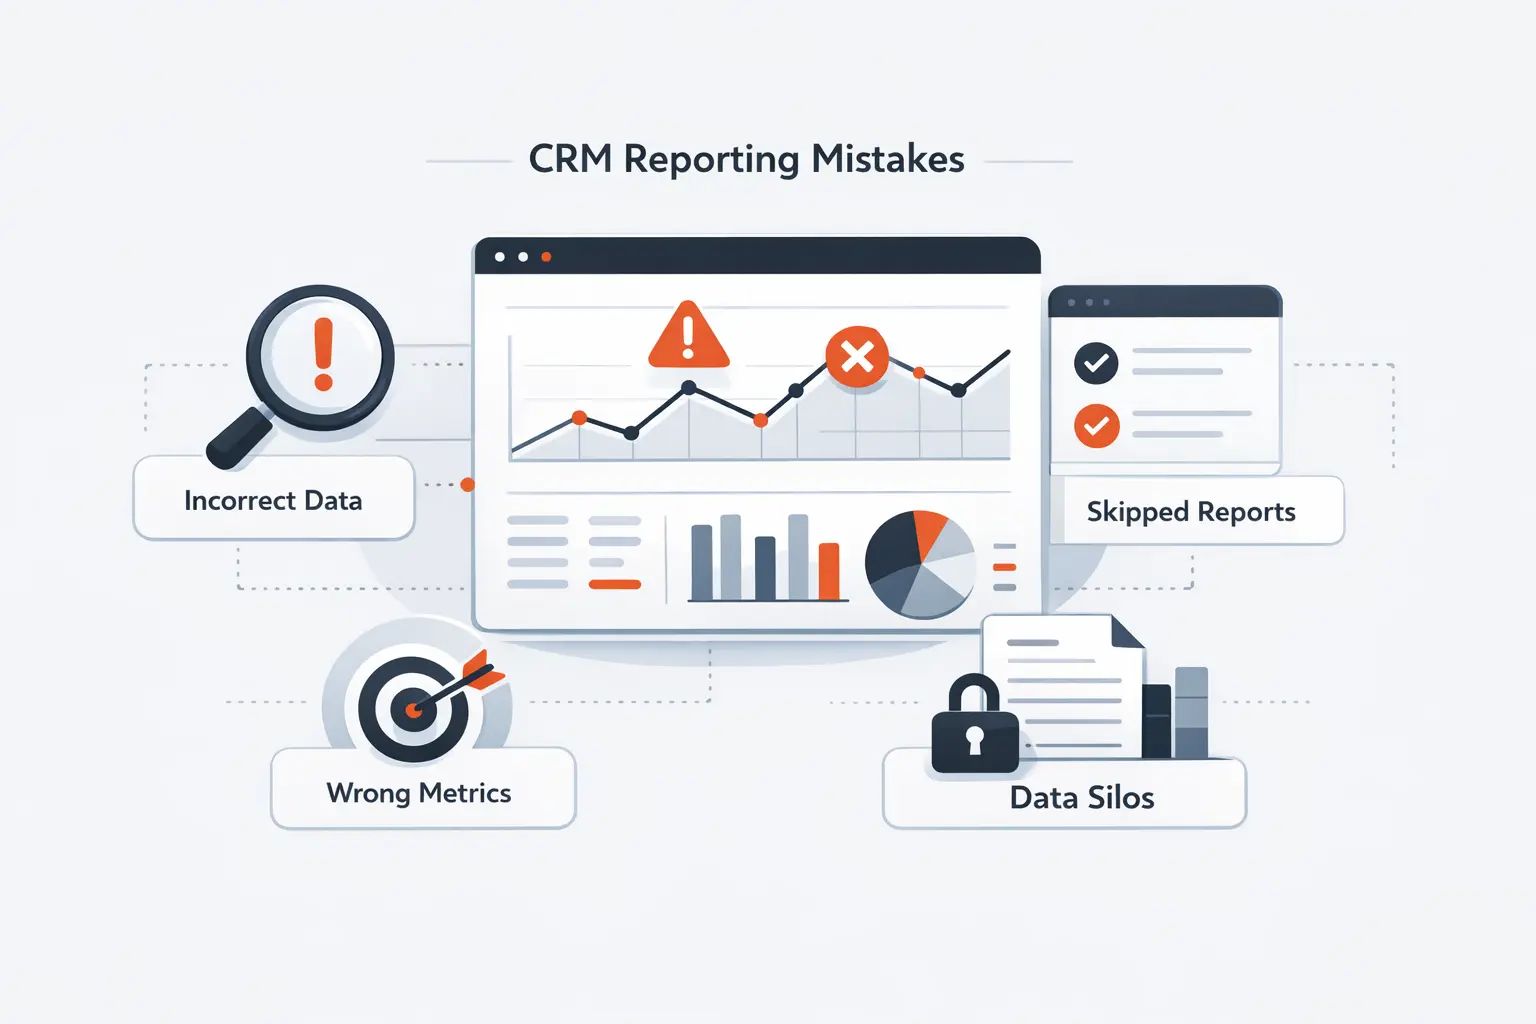
1. Overloading Dashboards With Too Many Metrics
Overloading dashboards with too many metrics is one of the fastest ways to destroy signal. Salesforce’s sample guidance explicitly recommends limiting displayed data, and HubSpot warns that dashboards can fail when reports request too many data points. We design dashboards as decision surfaces, which means each tile must earn its place by changing what someone does next.
2. Relying Only on Historical Data
Relying only on historical data is another common mistake. Rear-view reporting can explain what happened, but it cannot warn you about emerging risk unless you pair it with current pipeline views, live thresholds, and forward-looking models. The strongest CRM reporting stacks combine history, present-state visibility, and predictive signals so leaders can act before a miss becomes irreversible.
3. Ignoring Mobile Responsiveness and Dashboard Usability
Ignoring mobile responsiveness and dashboard usability quietly suppresses adoption. HubSpot lets users review dashboards and drill into supported KPI reports on mobile, while Salesforce documents that mobile has different report and dashboard behavior than desktop. We design for the field first: fast loading, obvious filters, readable labels, and drill paths that respect the device people actually use.
FAQ About CRM Reporting
1. What Does CRM Reporting Mean?
CRM reporting means turning structured CRM data into repeatable views that show customer, pipeline, marketing, service, and revenue performance. We think of it as the discipline that converts recordkeeping into decision support, whether the output is a granular report or an executive dashboard.
2. What Does a Useful CRM Report Usually Include?
A useful CRM report usually includes a clear business question, a defined time range, trusted metric logic, relevant filters, and a path back to the underlying records. The best versions also make ownership obvious so teams know who should act on what they are seeing.
3. What Is the Difference Between CRM Reports and Dashboards?
The difference is scope and purpose: a report analyzes a specific slice of data, while a dashboard presents multiple reports together for quick review and comparison. We use reports for investigation and dashboards for monitoring and action.
4. Which CRM Reports Should Sales Teams Prioritize First?
Sales teams should usually prioritize pipeline health, sales forecast, activity, lead-source, and win-loss reporting first. Those views give leadership the fastest read on whether enough demand exists, whether reps are working the right deals, and where revenue risk is accumulating.
5. How Does AI Improve CRM Reporting?
AI improves CRM reporting by accelerating report creation, summarizing patterns, surfacing anomalies, and improving forecasts. We see the biggest value when AI reduces manual interpretation and helps teams notice change sooner, not when it simply adds a chatbot on top of weak data.
How TechTide Solutions Helps With Custom CRM Reporting
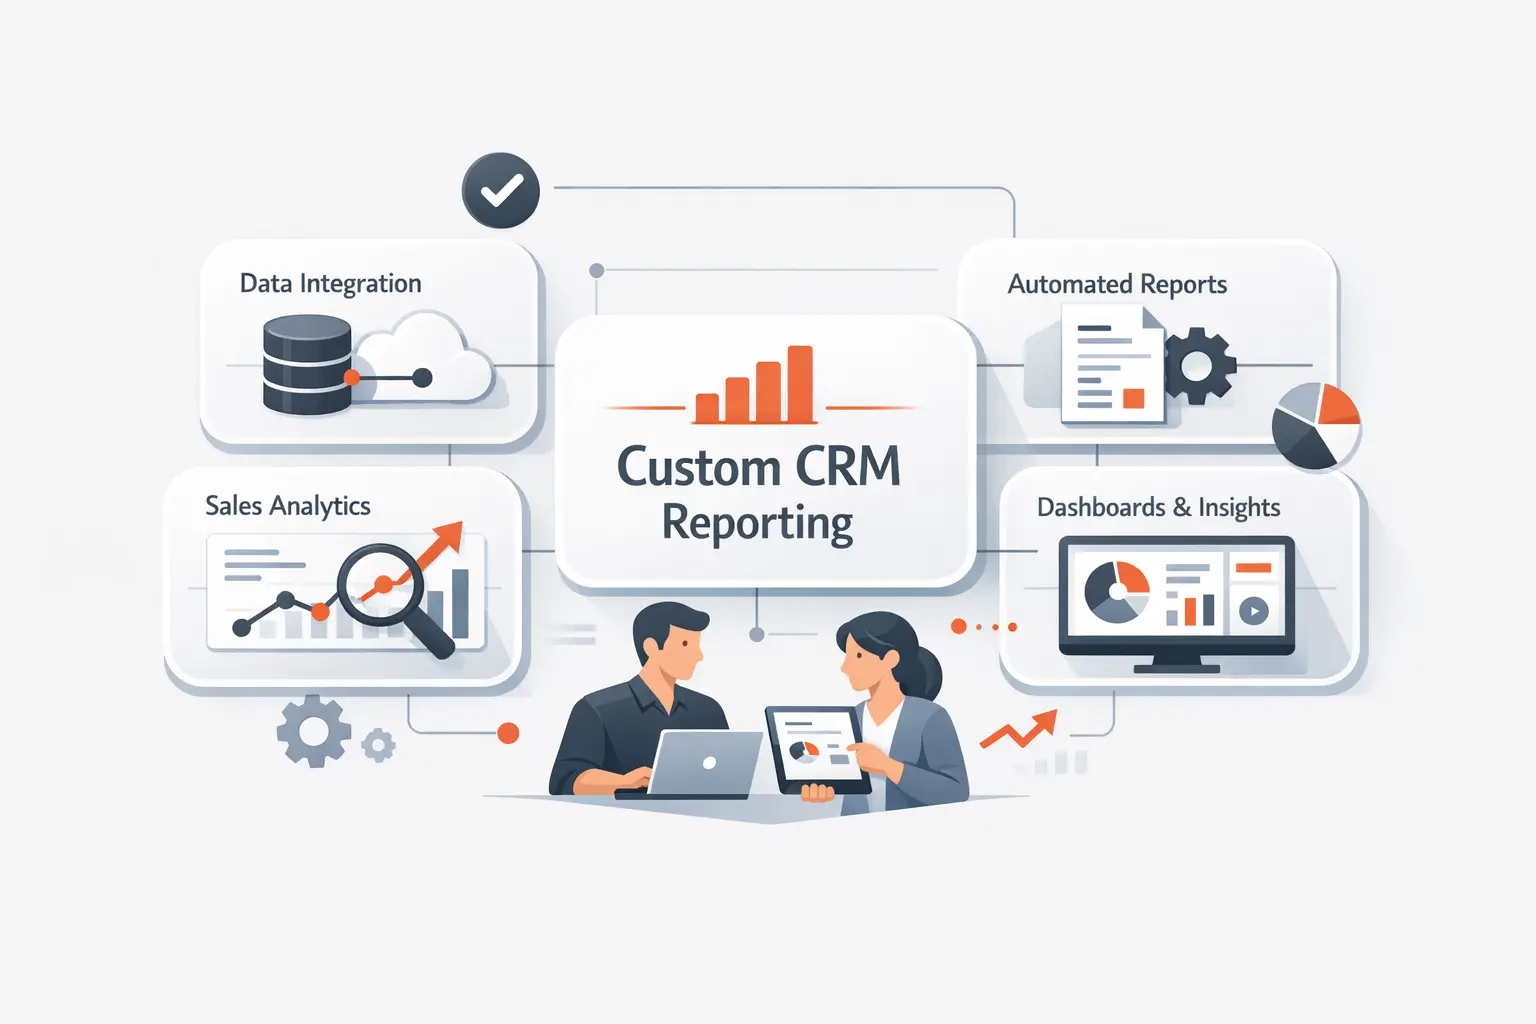
1. Custom Dashboards Built Around Your KPIs and Workflows
At TechTide Solutions, we build custom dashboards around the decisions your teams actually make, not around whatever charts a CRM happens to ship by default. We map KPI definitions, approval paths, role visibility, and workflow triggers before we design visuals, which helps the reporting layer stay aligned with how your business truly operates.
2. Integrated Solutions That Connect Sales, Marketing, and Support Data
We also connect sales, marketing, support, billing, and product data so your CRM reporting reflects the full customer journey instead of isolated departmental snapshots. Our teams handle APIs, event pipelines, schema mapping, deduplication logic, and access controls, which is usually where reporting projects either become strategic assets or fall back into spreadsheet debt.
3. Scalable Software Development for Reporting, Automation, and Growth
Because we are a software development company first, we do not stop at dashboard configuration. We build the surrounding systems: custom CRM extensions, reporting portals, automation jobs, data services, and integration layers that let reporting scale with new products, new markets, and more demanding governance requirements.
Final Thoughts on CRM Reporting
CRM reporting is not about producing more charts; it is about making customer-facing decisions faster and with less ambiguity. When the right data model, report logic, and delivery layer come together, teams forecast better, coach better, and serve customers better. If your current CRM reports feel noisy or political, perhaps the next step is simple: choose the decisions that matter most and rebuild the reporting around them, so which dashboard should your team trust first?
