In our world at Techtide Solutions, “500 internal server error” is the smoke alarm of the web: it tells you something went wrong on the server side, while telling you almost nothing about what specifically caught fire. The formal semantics are intentionally minimal: the HTTP specification describes 500 (Internal Server Error) as the server encountering an unexpected condition that prevented it from fulfilling the request, and that sparseness is part of the design.
What a 500 internal server error means in HTTP
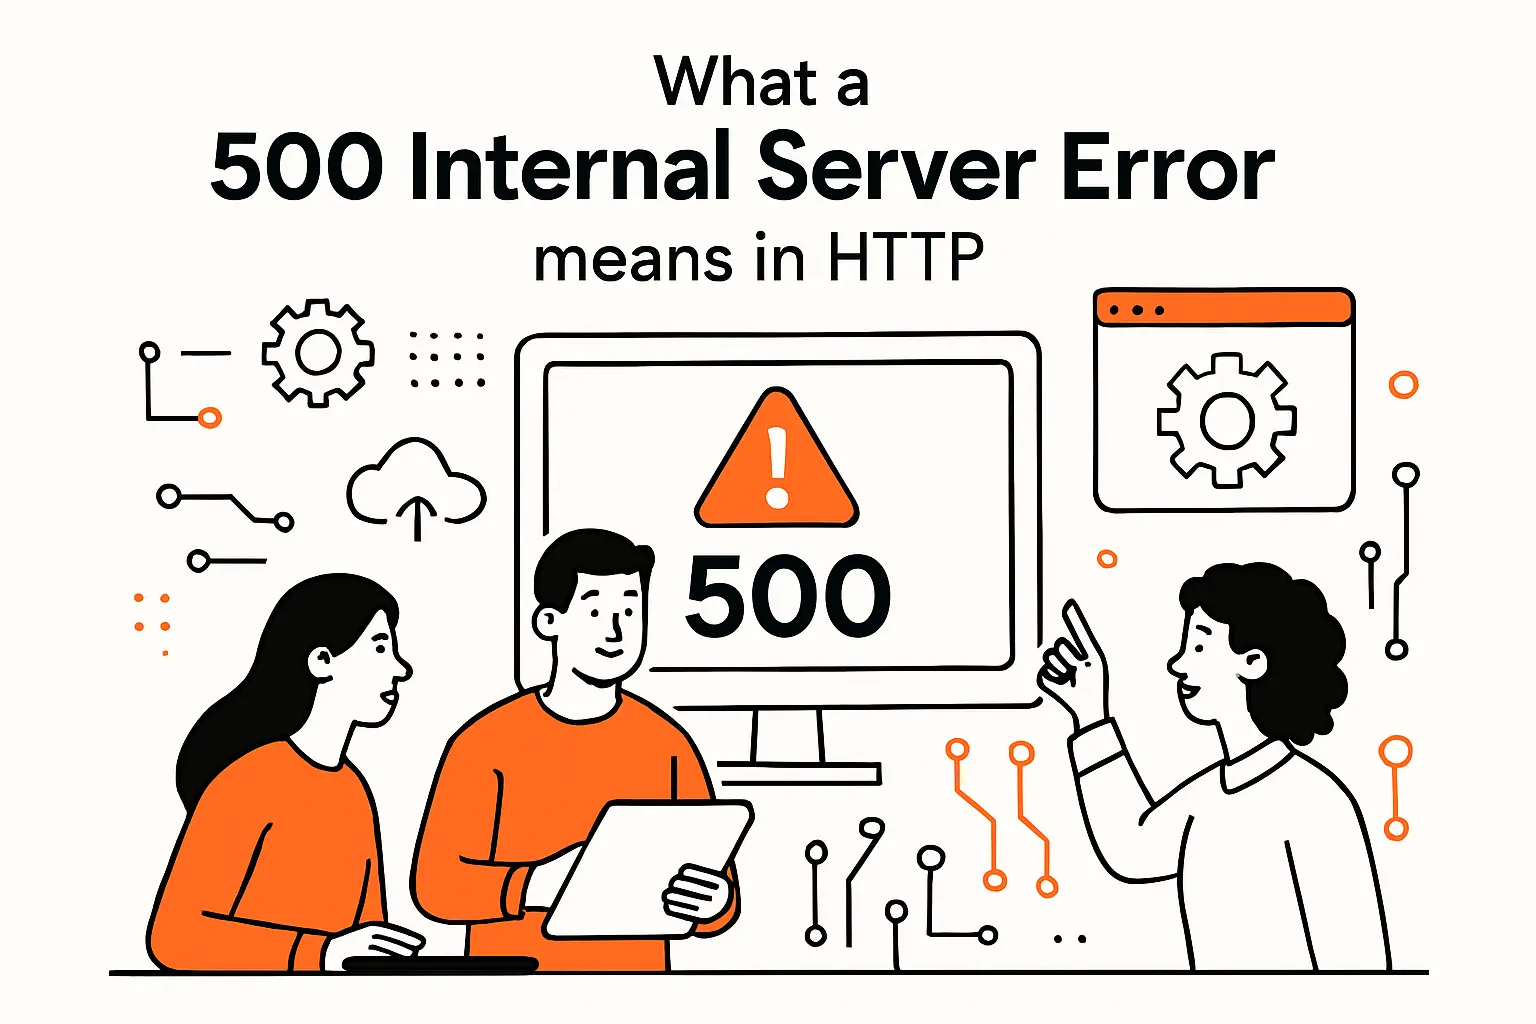
1. 500 as a generic server error response
Operationally, the generic nature is both blessing and curse. On one hand, it gives application servers and gateways a single “fail-safe” code that can be emitted when the stack is already unstable. On the other hand, it trains teams to treat 500s as mysterious—even though most 500s are perfectly explainable once you look at the right evidence (logs, traces, and dependency health) instead of staring at the browser.
From a business lens, this matters more than many leaders expect: if the public cloud market itself is forecast to total $723.4 billion in 2025 the implication is simple—more revenue paths run through HTTP than ever before, so the cost of “generic errors” compounds through support, churn, and lost automation.
2. When the server cannot return a more appropriate 5XX code
Most production systems have “more precise” server error codes available—gateway failures, upstream timeouts, temporary overload states, and so on. Yet 500 still appears because many frameworks emit it as a default when exceptions escape the request handler, when middleware can’t decide which error taxonomy applies, or when a reverse proxy receives an invalid upstream response that doesn’t map cleanly to a specialized status.
Architecturally, we treat 500 as a symptom of an error-handling boundary that did not catch and classify the failure. Sometimes that boundary is application code (an uncaught exception). Other times it’s configuration (an invalid directive). In modern distributed systems, a 500 can also be a “translation artifact,” meaning the actual failure happened elsewhere but got normalized to 500 by a gateway, load balancer, or platform component trying to be safe.
Where “classification” often breaks down
Practically speaking, classification usually breaks down in three places. First, framework error middleware may be disabled or bypassed. Second, an upstream dependency may fail without a clean error contract. Third, security layers may hide details to avoid leaking internals. Each case can still be handled well. However, that only happens when the implementation includes structured error contracts and correlation identifiers.
3. Why server owners and administrators usually must investigate
Visitors can retry; server owners must diagnose. That’s not moralizing—it’s just physics. Client-side actions (refreshing, switching networks) can occasionally route around a transient edge failure, but client-side actions cannot fix a broken rewrite rule, a crashed PHP worker pool, or a database that’s rejecting connections.
In our incident reviews, we often phrase it bluntly: a 500 is the server admitting guilt without providing testimony. The only reliable next move is to investigate server-side artifacts—error logs, platform events, deployment diffs, and dependency health—until the system explains itself. Once you build that muscle, “500” stops being a scary message and becomes a predictable workflow trigger.
Related Posts
- How to Fix ERR_SSL_PROTOCOL_ERROR Across Browsers and Devices
- How to Rename Database phpMyAdmin Safely: A Practical Guide for MySQL
- public_html Folder Missing in cPanel: Causes, Fixes, and Recovery Steps
- public_html permissions: Secure defaults and best practices for web hosting
- 503 Service Unavailable: What It Means, Common Causes, and How to Fix It
- 403 Forbidden: Causes, Fixes, and Prevention for Websites, Servers, and APIs
How 500 errors appear: status lines, error pages, and response bodies
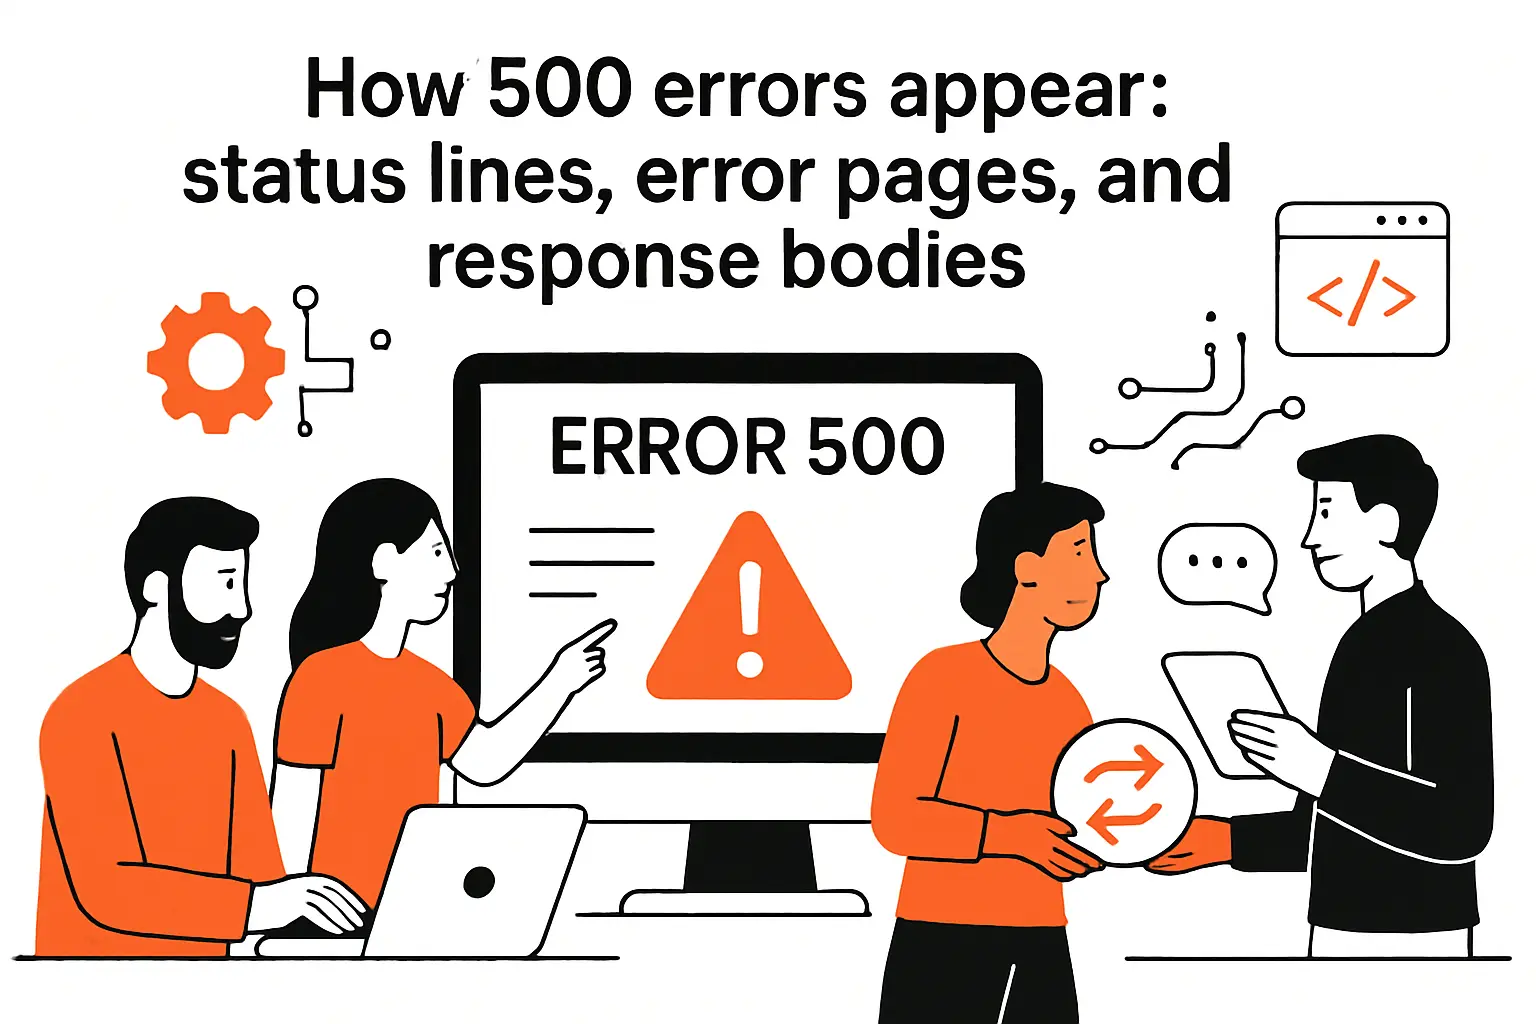
1. Common on-page message variations and wording
Even though the HTTP status is consistent, the human-facing text varies wildly. Some stacks show a plain “Internal Server Error,” while others display branded pages, apologetic language, or messages that nudge users to try again later. Proxy layers also rewrite messages, so what a user sees may reflect the CDN or ingress controller rather than the application.
In client support tickets, we regularly see confusion caused by mismatched wording: “server error,” “application error,” “something went wrong,” and “temporarily unavailable” can all correspond to the same 500. Because of that variability, we train teams to ask for the raw status code from the browser dev tools network tab, not just a screenshot of the page copy.
Why we prefer a consistent message
Consistency reduces support time. A stable error template can ask for a request ID, state whether the issue is transient, and provide a support path—all while withholding sensitive internals. Without that, every 500 becomes a detective novel written by the user, and the plot is rarely accurate.
2. Typical 500 HTML response content and support contact cues
A traditional website often returns an HTML document for a 500 because a human is expected to read it. Done well, this page communicates three things. First, the request failed. Next, retrying may work if the fault is temporary. Finally, support can help if the problem persists. Content should guide the next action without exposing stack traces, file paths, or infrastructure details.
We like support cues that do not require technical knowledge. Include a contact support link, a timestamp, and a copyable incident reference. On mature teams, that cue also shortens mean time to resolve. It connects the report to server side evidence and speeds troubleshooting.
3. Request IDs and logging for server-side follow-up
Request IDs are the bridge between “I saw a 500” and “here’s the exact failure in our logs.” When a system emits a unique identifier per request and includes it in both the response (header or body) and the server logs, support can jump directly from a user report to a specific trace of what happened.
At Techtide Solutions, we treat correlation IDs as non-negotiable in production APIs and web apps. Alongside the ID, we log structured fields (route, handler, user context, dependency latency, and exception type) so that triage is an exercise in filtering rather than guesswork. When request IDs are missing, teams compensate by widening log searches, which increases noise and slows remediation.
What to log with the ID
In practice, the most actionable bundle is: request ID, authenticated principal (or an anonymous marker), upstream dependency call outcomes, and the “decision points” (authorization, validation, serialization). With that, even a generic 500 becomes explainable within minutes rather than hours.
4. JSON fault responses and error codes from API platforms
APIs rarely return HTML; they return machine-readable payloads. Many API gateways and platforms wrap internal failures in a JSON “fault” document that contains an error code, a fault string, and sometimes an internal classification. For example, platform documentation often demonstrates that a backend callout failure can surface as a 500 with a structured fault response, such as the troubleshooting patterns described in 500 Internal Server Error guidance for API gateways.
One subtle trap shows up here: client teams sometimes treat any JSON body as “the truth,” even when the gateway is masking. Our stance is pragmatic—use the fault payload for correlation and first-pass classification, but treat server logs and traces as the authoritative record of why the platform decided to emit 500.
Common causes behind a 500 internal server error
1. Improper server configuration and misconfigured rules
Configuration failures are the classic “everything worked until we changed one tiny thing” cause. In Apache environments, a malformed directive in a distributed configuration file can break request processing for an entire directory tree. Documentation on .htaccess files explains why these files are powerful—and why they can become a foot-gun when syntax, allowed directives, or override permissions are misaligned.
Rewrite rules deserve special mention. A rewrite loop, a bad base path assumption, or a directive that depends on a module not enabled can trigger 500s. From a reliability standpoint, we prefer moving rewrite logic into version-controlled server config (or gateway config) rather than letting it drift across multiple folders where changes are hard to audit.
Our “config change” smell test
Whenever a 500 starts immediately after a deploy, we ask: did we change routing, headers, TLS, compression, caching, or rewrites? A yes answer usually narrows the search dramatically, because those layers fail loudly and early.
2. Unhandled exceptions and application-level failures
Unhandled exceptions are the software equivalent of stepping on a rake: the code runs fine until a particular input, state, or dependency response triggers a path that no one guarded. In a web handler, that often means exceptions escape the controller and bubble into the framework’s default error handler, which emits 500.
From our engineering perspective, the best fix is rarely “catch everything.” Instead, we want to classify failures at the right boundary: validation failures should become client errors, authorization failures should become access errors, and dependency failures should become well-defined server responses. When the codebase lacks that classification, 500 becomes the dumping ground for every category of mistake.
Real-world example we see often
A payment page that assumes a non-null shipping address might work for most users, then throw a null reference exception for users who qualify for digital-only checkout. That’s a server bug, but it’s also a contract problem: the handler should either require the field up front or branch intentionally.
3. Out-of-memory conditions and other resource exhaustion
Resource exhaustion produces 500s in more ways than “the server ran out of RAM.” Thread pools get saturated, database pools get exhausted, file descriptors hit limits, and CPU throttling turns timeouts into cascading failures. From the outside, the symptom looks identical: 500.
Inside the system, however, the signatures are distinct. A memory failure might show worker restarts or fatal runtime errors; a pool exhaustion might show queued requests and slow upstream calls; a disk exhaustion might show write failures for logs or caches. We approach this category by measuring: latency percentiles, queue depth, saturation signals, and dependency error rates.
Why these failures cascade
When a server is resource-starved, even error handling becomes expensive. Logging can block, retries can amplify traffic, and health checks can fail, causing load balancers to reshuffle traffic and intensify the hot spot. That’s why we like adaptive load shedding and explicit timeouts rather than hoping the system “powers through.”
4. Improper file permissions and access restrictions
Permissions issues look deceptively simple: a process can’t read a file, write a cache entry, or execute a script. On shared hosting, a common variant is that the web server user lacks the rights expected by the application, or the application accidentally tightened permissions during an update.
WordPress deployments are a frequent example because the ecosystem spans many hosting configurations. The official guidance on file permissions lays out how permission modes work and why overly permissive settings can be risky, while overly restrictive settings can break updates, uploads, and runtime behavior.
Where permissions break unexpectedly
Uploads directories, plugin update paths, and server-side caches are common hotspots. One pattern we’ve debugged repeatedly is a cache directory that was writable before a deployment, then got replaced by a directory owned by a different user during a restore, causing runtime writes to fail and bubble up as 500.
5. Database and backend server failures
Many “web server 500s” are actually backend failures in disguise. If the application can’t connect to the database, if migrations introduced an incompatible schema change, or if a downstream service started rejecting credentials, the request handler may throw an exception and return 500.
Dependency failures also interact with timeouts and retries. A database that is slow can be worse than a database that is down, because slow responses tie up worker capacity and create a thundering herd. In our practice, we prefer explicit timeouts and well-scoped retries with backoff, because indefinite waiting turns a single backend issue into system-wide failure.
Quick checks for visitors seeing a 500 internal server error
1. Clear the browser cache and retry
As visitors, the goal is to rule out stale assets or cached redirects that point to a broken path. Clearing the cache can force the browser to re-fetch the HTML, scripts, and any cached error responses. Although most 500s are truly server-side, this is a fast check that costs little and occasionally resolves issues caused by stale intermediaries.
From our support standpoint, we recommend a targeted approach first: hard refresh the page, then clear site-specific storage if the browser supports it. After that, a full cache clear is reasonable, especially if the site recently changed domains, routing structure, or authentication flow.
2. Try a different browser to rule out client-side issues
Switching browsers is less about “fixing” the server and more about isolating variables. Different browsers handle cached authentication, HSTS behavior, and extension interference differently. If a 500 only appears in one browser, that points to a session cookie edge case, a corrupted cached response, or an extension that mutates requests in transit.
In practice, we like to compare a normal browsing session with a private/incognito window. That single step changes cookie state and extension behavior, which can quickly reveal whether the issue is tied to authentication or request modification.
3. Test from another network to isolate connectivity problems
Network changes can route you to different edges of a CDN or different load balancer paths. A broken regional PoP, a DNS misconfiguration, or an enterprise proxy that rewrites headers can create localized failures. Trying another network helps confirm whether the problem is global or tied to a specific path to the origin.
For teams supporting enterprise users, this matters because “our site is down” sometimes means “your corporate egress is breaking TLS negotiation.” That’s still not a visitor’s fault, but the workaround can help them regain access while the underlying issue is addressed.
4. Reload the page when the problem is intermittent
Intermittent 500s often indicate instability rather than a deterministic bug: autoscaling churn, rolling deploys, cold starts, or a dependency that flaps between healthy and unhealthy. Reloading can succeed, but it can also conceal a real incident, so we see it as a temporary workaround—not closure.
When the error is intermittent, the best “visitor action” is to capture context for support: time of the failure, the exact URL, and any request ID shown. That short bundle often turns a vague report into an actionable investigation.
How to fix a 500 internal server error on a website you manage
1. Check server error logs for the file or folder triggering the error
Logs are where the system tells the truth, and we mean that literally. Server error logs commonly reveal the precise file, line, module, or upstream call that failed. Rather than staring at the browser message, we jump straight to the error log that corresponds to the request timeframe.
On Apache, that might be the virtual host error log; on NGINX, it might be an error log plus upstream logs; on managed platforms, it might be an aggregated logging console. The key move is correlation: align the user report time with the server log entry and confirm it’s the same request path, not a coincidental background error.
A triage question we ask immediately
Does the 500 happen for one route, one directory, or everything? If it’s isolated, logs usually show a localized failure (permission, rewrite, missing file). If it’s global, logs often show a process-wide crash, configuration load failure, or broken dependency initialization.
2. Use PHP error logs and WordPress debug logs for application-level issues
For PHP-based sites, application errors frequently live in PHP logs rather than web server logs. WordPress adds another layer: the platform can log runtime notices and fatal errors when debugging is enabled, as described in Debugging in WordPress guidance.
One nuance matters operationally. If WordPress never boots because the server fails earlier, WordPress logs may stay empty. In that case, rely on server and PHP logs instead. That distinction saves time when teams keep toggling debug flags. Often, the real issue is a server parse error or misconfiguration.
How we keep debugging safe
Debug modes should be temporary. In production, we prefer logging to files or centralized logging backends while keeping error display off for end users, because exposing stack traces can leak secrets and implementation details.
3. Fix .htaccess syntax errors and incorrect RewriteBase paths
Syntax errors in rewrite files are a high-frequency cause of immediate 500s on Apache-hosted apps. The rewrite engine’s behavior depends on correct directives and correct module availability, and the directive-level documentation for RewriteEngine is a helpful reference when troubleshooting whether rewriting is enabled and permitted in the directory context.
Incorrect base path assumptions are another common culprit. A site moved into a subdirectory can keep old rewrite assumptions, which leads to broken internal rewrites and, in some configurations, internal server errors. In those scenarios, we validate routing with a small set of representative URLs (home, deep page, static asset, admin login) to confirm that rewrites are working end-to-end.
4. Regenerate a clean .htaccess when corruption is suspected
Regenerating a clean rewrite file is often faster than editing a heavily modified one by hand. This is especially true on CMS platforms where plugins append rules over time. The safe method is simple. Back up the current file, replace it with a known good baseline, then restore required rules gradually.
In our experience, the biggest advantage here is not “magic correctness,” but controlled change. Each incremental addition becomes a testable hypothesis, and the first rule that reintroduces 500 becomes your smoking gun.
5. Reset file permissions: 644 for files and 755 for folders
Permissions fixes need discipline. While it’s tempting to “open everything up,” permissive settings can create security risks and hide the real mismatch between ownership and runtime user accounts. WordPress’s security guidance includes concrete recommendations and cautions in Hardening WordPress material, and we treat those principles as broadly applicable even outside WordPress.
Before changing anything, we identify which process user executes the application and which user owns the files, then we adjust ownership and permissions so that runtime needs are met without granting unnecessary write access. When teams skip that reasoning step, they fix today’s 500 and create tomorrow’s compromise.
6. Switch PHP versions when scripts time out or hit fatal errors
Runtime compatibility problems show up as 500s when a code path triggers an unsupported feature, deprecated behavior, or extension mismatch. PHP version shifts can also change how strict certain errors are, turning what used to be a warning into a fatal outcome depending on configuration.
Rather than guessing, we like to reproduce the failure in a staging environment that matches production. Then we test version adjustments as controlled experiments, watching for both correctness and performance regressions, because a “fix” that slows response time can simply convert immediate 500s into intermittent ones under load.
7. Repair databases and verify WordPress database credentials
Database connection failures can bubble up as generic server errors, especially when the application doesn’t handle connection exceptions gracefully. Credential drift happens more than teams admit: a password rotated in a secret store but not deployed, a hostname changed during migration, or a database user stripped of permissions during a security hardening effort.
Our standard approach is to validate connectivity from the application runtime context (not from an admin laptop), then verify that required privileges exist for the application’s queries. Once connectivity is stable, integrity checks and repairs become meaningful; before that, they’re noise.
8. Disable WordPress plugins methodically and replace problematic ones
Plugin ecosystems bring speed, but they also bring risk. A plugin can introduce a fatal PHP error, register conflicting rewrite rules, or perform expensive work on every request. In WordPress support guidance, the practical approach is to disable plugins and re-enable them one by one to identify the offender, a workflow reinforced repeatedly in community troubleshooting playbooks.
Methodical matters here. If you disable everything at once and the site comes back, the next step is not “turn things back on randomly.” Instead, we reintroduce plugins in a measured sequence, prioritizing the most recently changed components and the ones that hook into request routing, authentication, or caching.
Replacement strategy we recommend
Once a plugin is implicated, the decision is whether to patch, replace, or remove. For business-critical functionality, we often replace “mystery-meat” plugins with fewer, better-maintained components or with custom code we can test and observe.
9. Change the WordPress theme to isolate theme-related errors
Themes can throw 500s too, especially when they embed custom PHP logic, integrate third-party APIs, or assume certain plugins exist. Switching to a default theme is a clean isolation test: if the error disappears, the theme is part of the failure chain.
At Techtide Solutions, we treat themes as code, not decoration. That mindset means code review, controlled rollouts, and basic observability—because a theme with a hidden performance problem can trigger resource exhaustion patterns that look like “random” 500s under traffic spikes.
10. Increase PHP memory limit when scripts exceed available memory
Memory failures often present as sudden 500s during image processing, imports, plugin activation, or pages that build large in-memory structures. Raising the limit can be a valid mitigation, but we prefer to treat it as a hypothesis: if memory is the constraint, why did this endpoint allocate so much, and can we reduce peak usage?
Sometimes the right fix is to optimize queries, paginate large datasets, stream responses, or offload heavy processing to background jobs. Increasing memory without changing behavior is like buying a bigger suitcase for a packing problem—it helps, but it doesn’t teach better habits.
11. Restore a backup to roll back recent breaking changes
Rollback is an underrated skill. When a site starts returning 500s immediately after a change, restoring a known-good backup can rapidly return service while the team investigates offline. The key is to restore with intent: capture the current broken state for forensic analysis, then roll back in a way that preserves essential user data where possible.
In operational maturity terms, a rollback plan is part of reliability engineering. If rollback is slow or scary, teams delay it, and the outage lasts longer than it should.
12. Check for oversized files that the server cannot open via the web
Oversized responses and uploads can fail at multiple layers: the application, the reverse proxy, the runtime, or the CDN. The end user might still see 500 even when the true failure is a request body limit, a timeout, or a buffering constraint.
Our diagnostic move is to reproduce with a controlled request and observe where the failure occurs. Once the boundary is identified, the fix might be adjusting limits, chunking uploads, using signed direct-to-object-storage uploads, or streaming downloads instead of buffering them in memory.
13. Monitor 5XX errors to protect crawlability and SEO
Even if humans tolerate a transient 500, search engines react operationally. Google’s crawling documentation notes that 5xx (server errors) prompt Google’s crawlers to temporarily slow down with crawling, and persistent server errors can affect indexing outcomes, which turns “just an ops issue” into a discoverability and revenue issue.
Monitoring should therefore be proactive: alert on spikes, segment by route and user journey, and correlate with deploy events. When observability is in place, SEO impact becomes a measurable risk rather than a vague fear.
500 internal server error in APIs: troubleshooting requests, gateways, and backends
1. Postman checklist: validate JSON, headers, query parameters, body, and HTTP method
APIs amplify mistakes because they are less forgiving than browsers. A slightly malformed JSON body, a missing header, or the wrong HTTP method can trigger unexpected server paths and lead to 500 if the backend fails to validate inputs defensively. Postman’s own support guidance emphasizes checking request configuration carefully in Fixing a 500 internal server error response rather than assuming the tool is at fault.
Our internal API debugging checklist starts with reproducibility: confirm the exact request (method, URL, headers, and body), then compare it to the API contract. Next, we remove variables: try the simplest valid request first, then add complexity until the failure returns.
A practical habit that saves hours
Instead of debugging with a “kitchen sink” request, we bisect. Half the headers, half the body fields, and half the query parameters disappear, and the request either stabilizes or still fails—either outcome narrows the search.
2. Confirm API documentation and check the service status page before escalating
APIs are living systems, and documentation can lag behind deployments. Before escalating, we confirm whether the endpoint has changed, whether authentication requirements shifted, and whether the provider is reporting an outage. Doing this early prevents a common failure mode: engineering spends hours debugging a request that was correct yesterday, while the platform is currently degraded.
From a vendor-management viewpoint, we also recommend capturing evidence before escalation: timestamps, request IDs, and any gateway correlation identifiers. That transforms “your API is broken” into a support ticket that can be routed and resolved.
3. Apigee Edge: decide whether the 500 originated in a policy or the backend server
With gateways, the first question is provenance: did the gateway generate the 500 due to a policy failure, or did it propagate a 500 from the backend? That distinction matters because the remediation paths differ—policy failures often require configuration changes, while backend failures require application fixes or dependency work.
Apigee’s troubleshooting material highlights common patterns where policy execution failures surface as 500, and we like this framing because it forces a decision tree: isolate the failing policy step, then confirm whether the backend itself is healthy under equivalent conditions.
4. Use Trace sessions to pinpoint the failed policy and inspect error properties
Trace tooling is one of the most effective ways to turn a generic 500 into a precise failure point. By inspecting the step-by-step execution, you can see whether the request was transformed, whether a callout executed, and what variables were set or missing when a policy failed.
In our field work, Trace sessions often reveal “invisible” mistakes: a header removed by one policy that another policy assumes exists, or a variable name that differs by a single character. Those bugs are nearly impossible to spot from the outside, yet they become obvious when you observe execution in context.
5. When Trace is unavailable: use NGINX access logs and Message Processor logs with request IDs
Sometimes Trace isn’t available due to permissions, performance constraints, or incident severity. In those cases, we fall back to correlation across layers: ingress logs, gateway logs, and backend logs tied together by a shared request ID. The important move is to ensure the ID is propagated downstream consistently so that each layer can tell part of the story.
From a logging design perspective, we aim for a single “golden thread” identifier, because otherwise investigations devolve into probabilistic matching on timestamps and client IPs, which breaks down quickly in NAT’d or high-throughput environments.
6. Common Apigee examples: ServiceCallout execution failures and connection timeouts
Service callouts are a frequent source of surprises: the proxy is healthy, but the callout target is not. In gateway ecosystems, those failures are often converted into 500s because the proxy cannot complete the overall request workflow. The platform’s ServiceCallout reference explains that timeouts and execution failures can return an HTTP 500, as described in the ServiceCallout policy documentation, and that’s exactly what we see in real systems when downstream services flap.
When this happens, we validate both sides: confirm the callout URL, credentials, TLS settings, and expected response shape; then confirm the downstream service is reachable and behaving correctly under the gateway’s network and identity context. Frequently, the “fix” is not changing the callout at all, but making the backend more reliable and faster under load.
7. Backend diagnosis: review server logs, enable debug mode, and verify credentials
Once the gateway points to the backend, the backend must be interrogated like any other web service. Logs should show whether the request arrived, which handler executed, and what exception occurred. If logs are missing, that absence is itself a clue: the request might not be reaching the backend due to network ACLs, DNS misrouting, or TLS negotiation failures upstream.
Credential verification is a classic gotcha. A backend that depends on secrets (database credentials, third-party API keys) can start failing after a secret rotation, and the resulting exception often surfaces as 500 unless explicitly handled. We recommend verifying secrets from the runtime environment rather than relying on configuration files that may not reflect the deployed container or service identity.
8. Node.js backends: check Node.js logs and isolate errors from custom code
Node.js services are fast to build—and also easy to crash if error handling is inconsistent across async boundaries. Unhandled promise rejections, thrown errors in middleware, and JSON serialization failures can all surface as 500s. The debugging discipline is the same: capture the request context, inspect the stack trace in logs, and identify whether the error originates in custom code or in an upstream dependency call.
In our builds, we lean on centralized error middleware, strict input validation, and structured logs that include request IDs. That combination prevents the most frustrating category of Node incidents: “it returned 500 but nothing logged,” which usually means the process crashed or the logging path failed under pressure.
9. Resolution patterns: fix the policy and redeploy, or fix the backend implementation
Resolution is ultimately about choosing the correct locus of change. If the gateway policy is wrong—bad variable, bad transformation, incorrect target URL—then fix it and redeploy the proxy. If the backend is unstable—exceptions, dependency failures, performance collapse—then fix the backend and validate with the gateway in the loop.
At Techtide Solutions, we push for a repeatable “two-track” resolution workflow: gateway owners fix classification, propagation, and observability; backend owners fix correctness, performance, and dependency resilience. When both tracks move in parallel, 500s stop reappearing as the same recurring incident with a new timestamp.
IIS and ASP.NET deployments: getting actionable details from a 500 internal server error
1. Enable detailed error output in IIS 7 using httpErrors and customErrors
IIS environments can be particularly opaque because production defaults are designed to hide sensitive details from remote clients. That security posture is correct, yet it frustrates debugging unless you know the right knobs. Microsoft’s IIS guidance on how to use HTTP Detailed Errors explains how IIS decides between custom and detailed errors and how configuration affects what the client sees.
From an engineering perspective, detailed errors are a scalpel, not a lifestyle. The goal is to enable enough detail to identify the failing module or application layer, then revert to safer settings once the issue is resolved.
2. Use local browsing on the server to see detailed error pages
Local browsing is a surprisingly effective technique on IIS because many configurations show details only to local requests. When you access the site from the server itself (or via an approved admin channel), you can often see the richer diagnostic page that remote users are shielded from.
In our incident playbooks, we treat “local vs remote difference” as an explicit test. If local reveals a configuration exception, a missing module, or a handler mapping problem, you can move directly to the corrective action instead of guessing from a generic 500 page.
3. Check Event Viewer for server-side error details
Windows Event Viewer is often the missing piece in IIS investigations. Application pool crashes, .NET runtime failures, and configuration load errors can leave traces there even when web logs look unhelpful. When a 500 seems “silent,” Event Viewer frequently contains the only clue that a worker process is terminating or failing to start.
Operationally, we correlate the event timestamp with the reported outage window and then tie that to deployment changes, configuration edits, or certificate rotations. This correlation step turns an overwhelming event stream into a targeted diagnostic path.
4. Keep debug settings temporary to avoid exposing sensitive information
Debug configuration is a tradeoff: more detail for faster fixes, but more risk if exposed publicly. That’s why we keep debug settings time-boxed and, when possible, scope them to local access only. Once the root cause is identified, we revert to custom errors and keep the detailed data in server-side logs and monitoring systems instead of in responses.
As a rule of thumb, we never want stack traces, file system paths, connection strings, or framework version banners visible to end users. Those details accelerate attackers just as easily as they accelerate engineers.
TechTide Solutions: Custom software to reduce 500 internal server error incidents
1. Build tailored web apps and APIs with resilient error handling and validation
Reducing 500s is not only an operations problem; it’s a software design problem. When we build custom systems, we implement explicit validation, predictable error contracts, and “fail well” behaviors so that client mistakes become client errors and dependency issues become actionable server responses rather than generic failures.
In practice, this looks like defensive parsing, schema validation at boundaries, consistent exception handling, and careful dependency wrappers that time out and degrade gracefully. The payoff is that 500 becomes rarer, and when it does occur, it carries enough context for rapid triage.
Why validation is a reliability feature
Validation isn’t just about correctness; it’s about protecting the server from ambiguous work. If inputs are known-good, fewer branches can throw, fewer edge cases reach deep code paths, and fewer requests trigger expensive operations that amplify resource exhaustion.
2. Implement observability: structured logging, request IDs, and actionable diagnostics
We can’t fix what we can’t see. Our default observability stack includes structured logs, correlation IDs across every hop, and metrics that capture saturation and latency—not just error counts. When 500s spike, we want to answer “which routes,” “which tenants,” “which dependencies,” and “which deploy” in minutes.
Beyond tooling, we also engineer diagnostics into the product: safe error pages for humans, predictable JSON faults for APIs, and internal dashboards that connect user reports to server evidence. That approach shrinks the gap between symptom and cause, which is the real battle in reliability.
3. Deliver custom remediation workflows: safe configuration changes, monitoring, and faster releases
Many organizations get stuck because the fix is known, but the change process is risky. Our remediation work often includes building safer deployment pipelines, adding automated config checks, and creating rollback-friendly release strategies. Once releases become predictable, teams stop “babying production,” and they fix root causes instead of living with recurring 500s.
Next steps tend to be surprisingly concrete: add correlation IDs, standardize error handling, alert on spikes, and review the top failing endpoints weekly. Over time, that operational rhythm shifts 500s from emergencies to engineering tasks with an owner and a due date.
Conclusion: A repeatable approach to diagnosing and fixing 500 internal server error
1. Confirm the scope: one page, whole site, or specific endpoint
Scope is the first compass. If one page fails, suspect handler logic, templates, or permissions in that directory. If the whole site fails, suspect global configuration, application boot failures, or critical dependencies. And if only one API endpoint fails, suspect a code path, payload shape, or a downstream call unique to that operation.
In our experience, this single question eliminates most dead ends. A broad outage calls for platform-level inspection; a narrow outage calls for code and contract inspection.
2. Collect evidence: logs, traces, and error payloads
Evidence beats intuition. Gather the request ID, the timestamp, and the exact URL or endpoint. Then pull the server logs and traces that correspond to that context. When evidence is missing, fix that gap immediately, because recurring 500s without observability are how teams end up with chronic outages and no clear accountability.
As Techtide Solutions, we also recommend preserving the first “good” reproduction. Once you can reproduce, you can bisect changes, test mitigations, and confirm the fix—without guessing.
3. Apply targeted fixes and monitor for recurring 5XX spikes
Targeted fixes are the antidote to panic changes. If the evidence points to a rewrite rule, fix the rule and retest. If the evidence points to a plugin, disable it and replace it. And if the evidence points to a dependency failure, improve timeouts, resilience, and capacity. After remediation, monitoring is not optional: recurring spikes are how you learn whether you fixed the cause or merely changed the symptom.
So here’s our next-step question: if a 500 happened in your system tomorrow, would you have a request ID, a trace, and a clear owner within minutes—or would you still be reading a generic error page and hoping it goes away?


