


95.9% of the top 1,000,000 home pages still have detectable WCAG 2 failures in 2026 (WebAIM, The WebAIM Million 2026). Mobile now accounts for 51.51% of worldwide web traffic, ahead of desktop at 47.12% (StatCounter, Mobile vs Tablet vs Desktop Market Share Worldwide – June 2026). WordPress powers 41.5% of all websites, which means a huge share of web development work still happens inside one dominant CMS ecosystem (W3Techs, Usage Statistics and Market Share of Content Management Systems, June 2026). This article draws on primary datasets, original surveys, and official labor data instead of secondhand stat roundups. Most headline figures come from 2026 releases, while the older numbers mainly serve as 2025 baselines for year-over-year comparison. That mix matters right now because Web Development Statistics 2026 is really a story about three gaps: between traffic and performance, between developer preferences and the live web, and between shipping features and shipping usable sites.
Key Takeaways
- Mobile generated 51.51% of worldwide web traffic in June 2026, versus 47.12% from desktop and 1.36% from tablet (StatCounter, Mobile vs Tablet vs Desktop Market Share Worldwide – June 2026).
- WordPress runs 41.5% of all websites and 59.2% of websites with a known CMS as of June 2026 (W3Techs, Usage Statistics and Market Share of Content Management Systems, June 2026).
- 29.9% of websites use none of the content management systems W3Techs tracks (W3Techs, Usage Statistics and Market Share of Content Management Systems, June 2026).
- 95.9% of top home pages had detectable WCAG 2 failures in 2026 (WebAIM, The WebAIM Million 2026).
- The average top home page now carries 56.1 detectable accessibility errors (WebAIM, The WebAIM Million 2026).
- Low contrast text appears on 83.9% of top home pages, making it the most common detected accessibility issue (WebAIM, The WebAIM Million 2026).
- U.S. web developers and digital designers are projected to grow 7% from 2024 to 2034 (U.S. Bureau of Labor Statistics, Occupational Outlook Handbook: Web Developers and Digital Designers 2025).
- The occupation is projected to create about 14,500 openings a year over the decade (U.S. Bureau of Labor Statistics, Occupational Outlook Handbook: Web Developers and Digital Designers 2025).
- Median annual pay reached $98,090 for web and digital interface designers and $90,930 for web developers in May 2024 (U.S. Bureau of Labor Statistics, Occupational Outlook Handbook: Web Developers and Digital Designers 2025).
- U.S. web developers and digital designers held 214,900 jobs in 2024 (U.S. Bureau of Labor Statistics, Occupational Outlook Handbook: Web Developers and Digital Designers 2025).
Recommended reading: WordPress Usage Statistics 2026: 18+ Findings on Market Share, Versions, and Security
Hiring Still Grows 7% as U.S. Web Roles Stay Well Paid
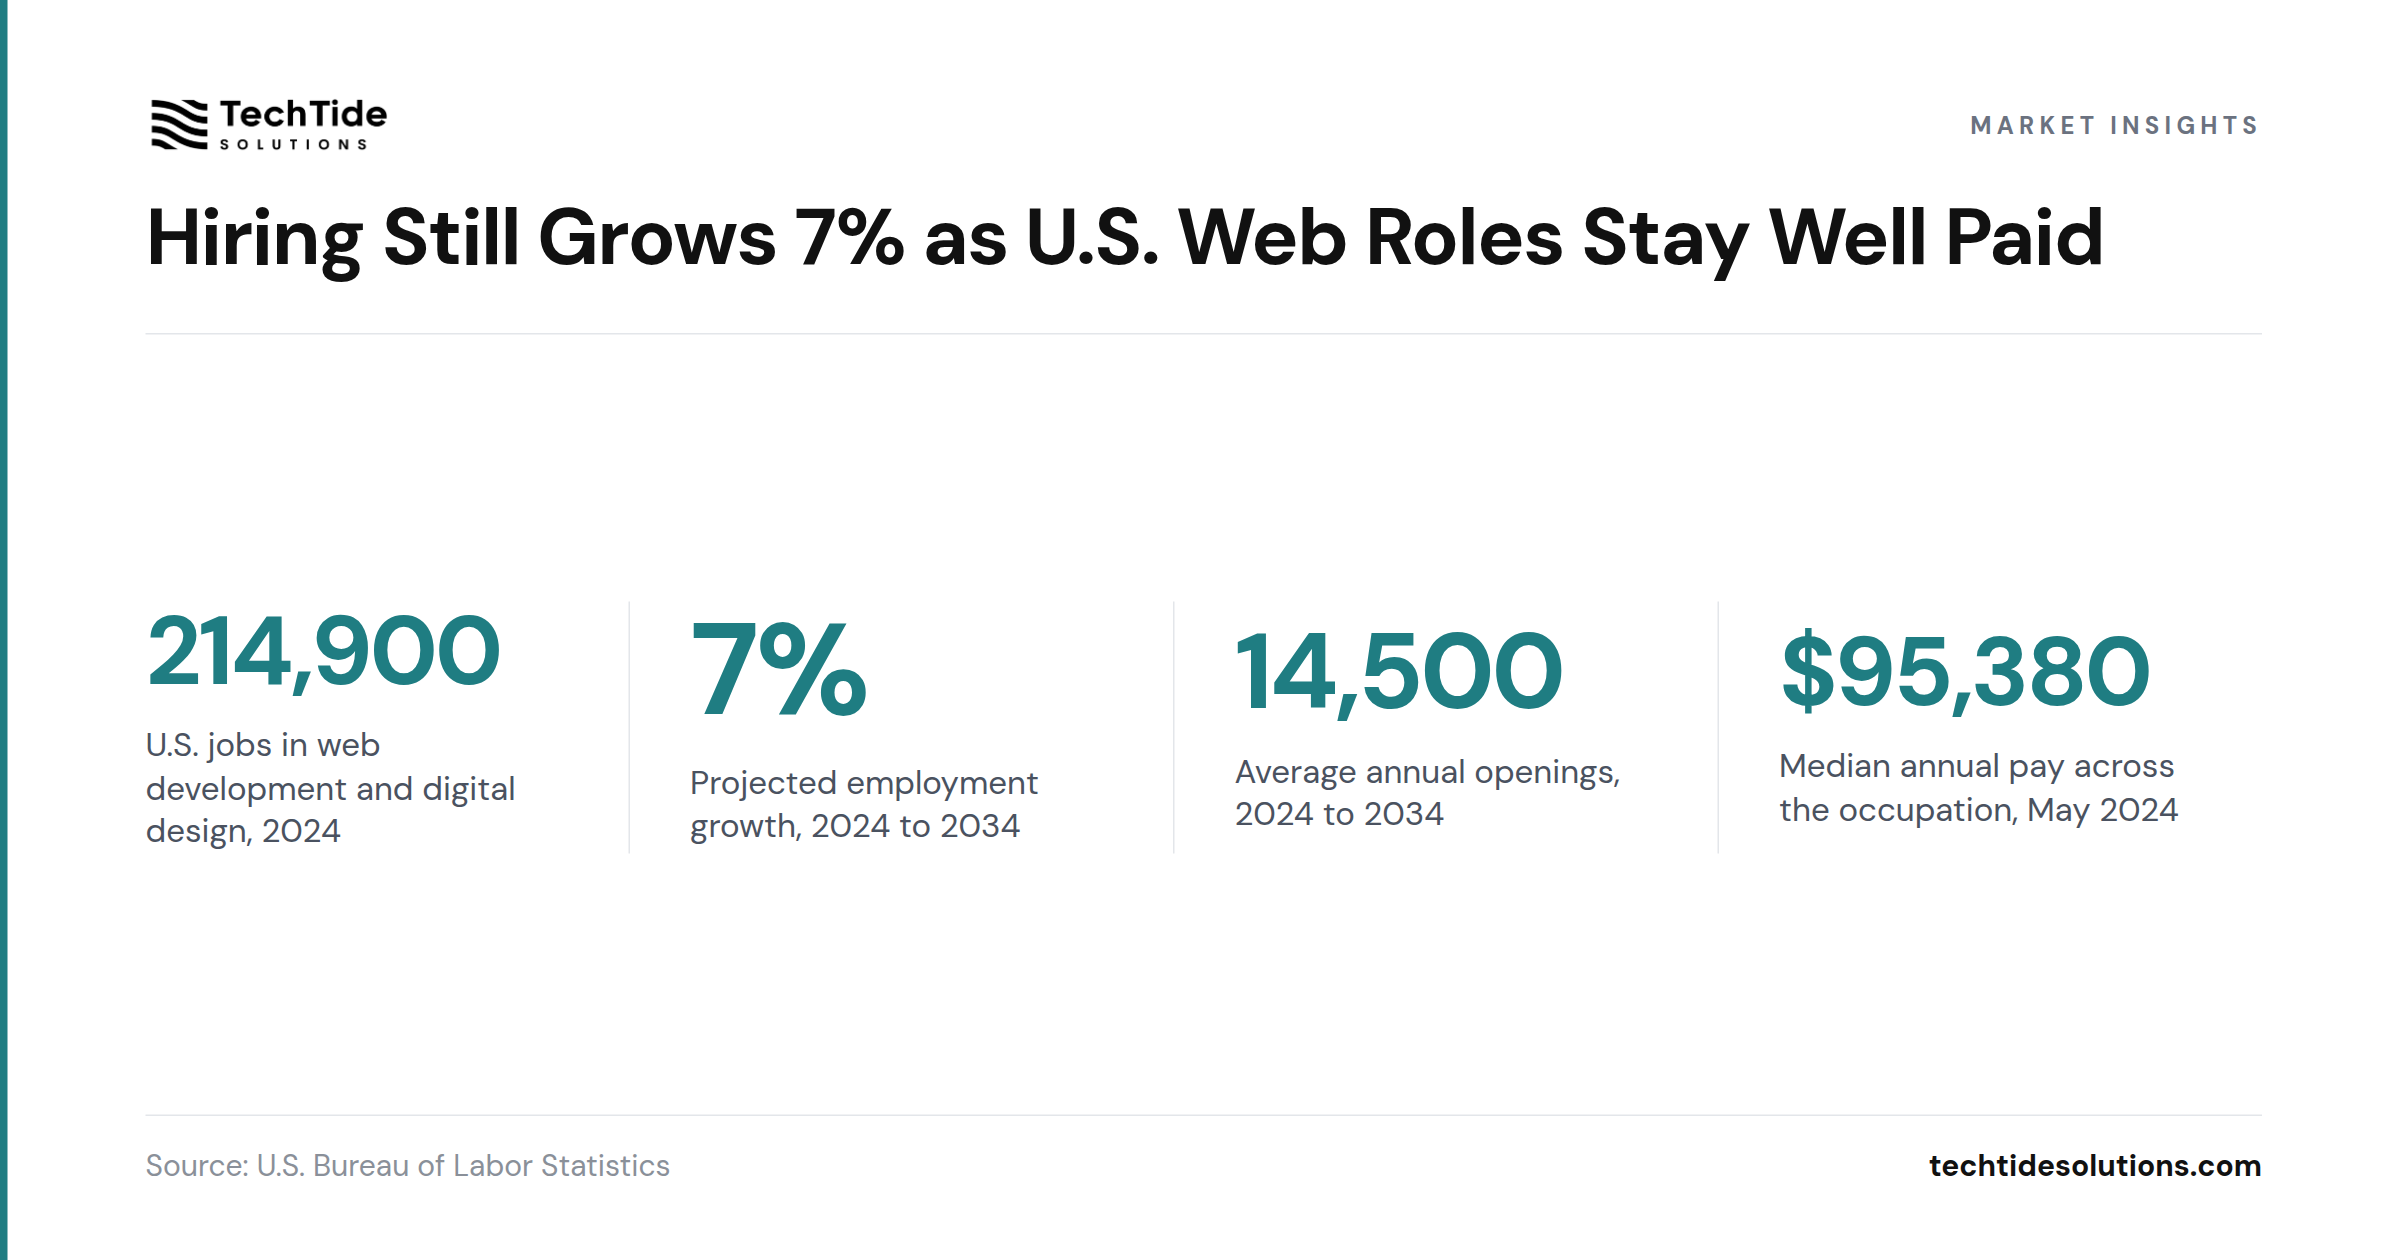
Overall employment of U.S. web developers and digital designers is projected to grow 7% from 2024 to 2034, with about 14,500 openings a year (U.S. Bureau of Labor Statistics, Occupational Outlook Handbook: Web Developers and Digital Designers 2025). The labor market looks steady rather than overheated. Demand is coming from the web staying central to commerce, content, and interfaces, not from a short-lived hiring spike.
Among Stack Overflow’s 2025 survey respondents in the United States, 45% say they work remotely, which shows how distributed this career still is even after some office pullback (Stack Overflow, 2025 Stack Overflow Developer Survey: Work). Among all respondents in Stack Overflow’s 2025 survey, 84% say they use or plan to use AI tools in their development process, which points to workflow change more than job collapse (Stack Overflow, 2025 Stack Overflow Developer Survey: AI).
| Metric | Value | Source |
|---|---|---|
| U.S. jobs in web development and digital design, 2024 | 214,900 | U.S. Bureau of Labor Statistics |
| Projected employment growth, 2024 to 2034 | 7% | U.S. Bureau of Labor Statistics |
| Average annual openings, 2024 to 2034 | 14,500 | U.S. Bureau of Labor Statistics |
| Median annual pay across the occupation, May 2024 | $95,380 | U.S. Bureau of Labor Statistics |
Within that total, median annual pay was $98,090 for web and digital interface designers and $90,930 for web developers in May 2024 (U.S. Bureau of Labor Statistics, Occupational Outlook Handbook: Web Developers and Digital Designers 2025).
Takeaway: Web development still pays like a skilled technical field, but the winning profile now mixes coding, UX, performance, and AI-assisted workflow judgment.
Recommended reading: WordPress Security Statistics 2026: 22+ Findings on Vulnerabilities, Core Fixes, and Malware
Mobile Generates 51.51% of Web Traffic, but Only 48% of Sites Pass Mobile CWV
Mobile accounted for 51.51% of worldwide web traffic in June 2026 (StatCounter, Mobile vs Tablet vs Desktop Market Share Worldwide – June 2026). Traffic has been mobile-first for years, but quality still is not. The performance gap matters because mobile is where slower hardware, weaker connections, and fragile layouts show up fastest.
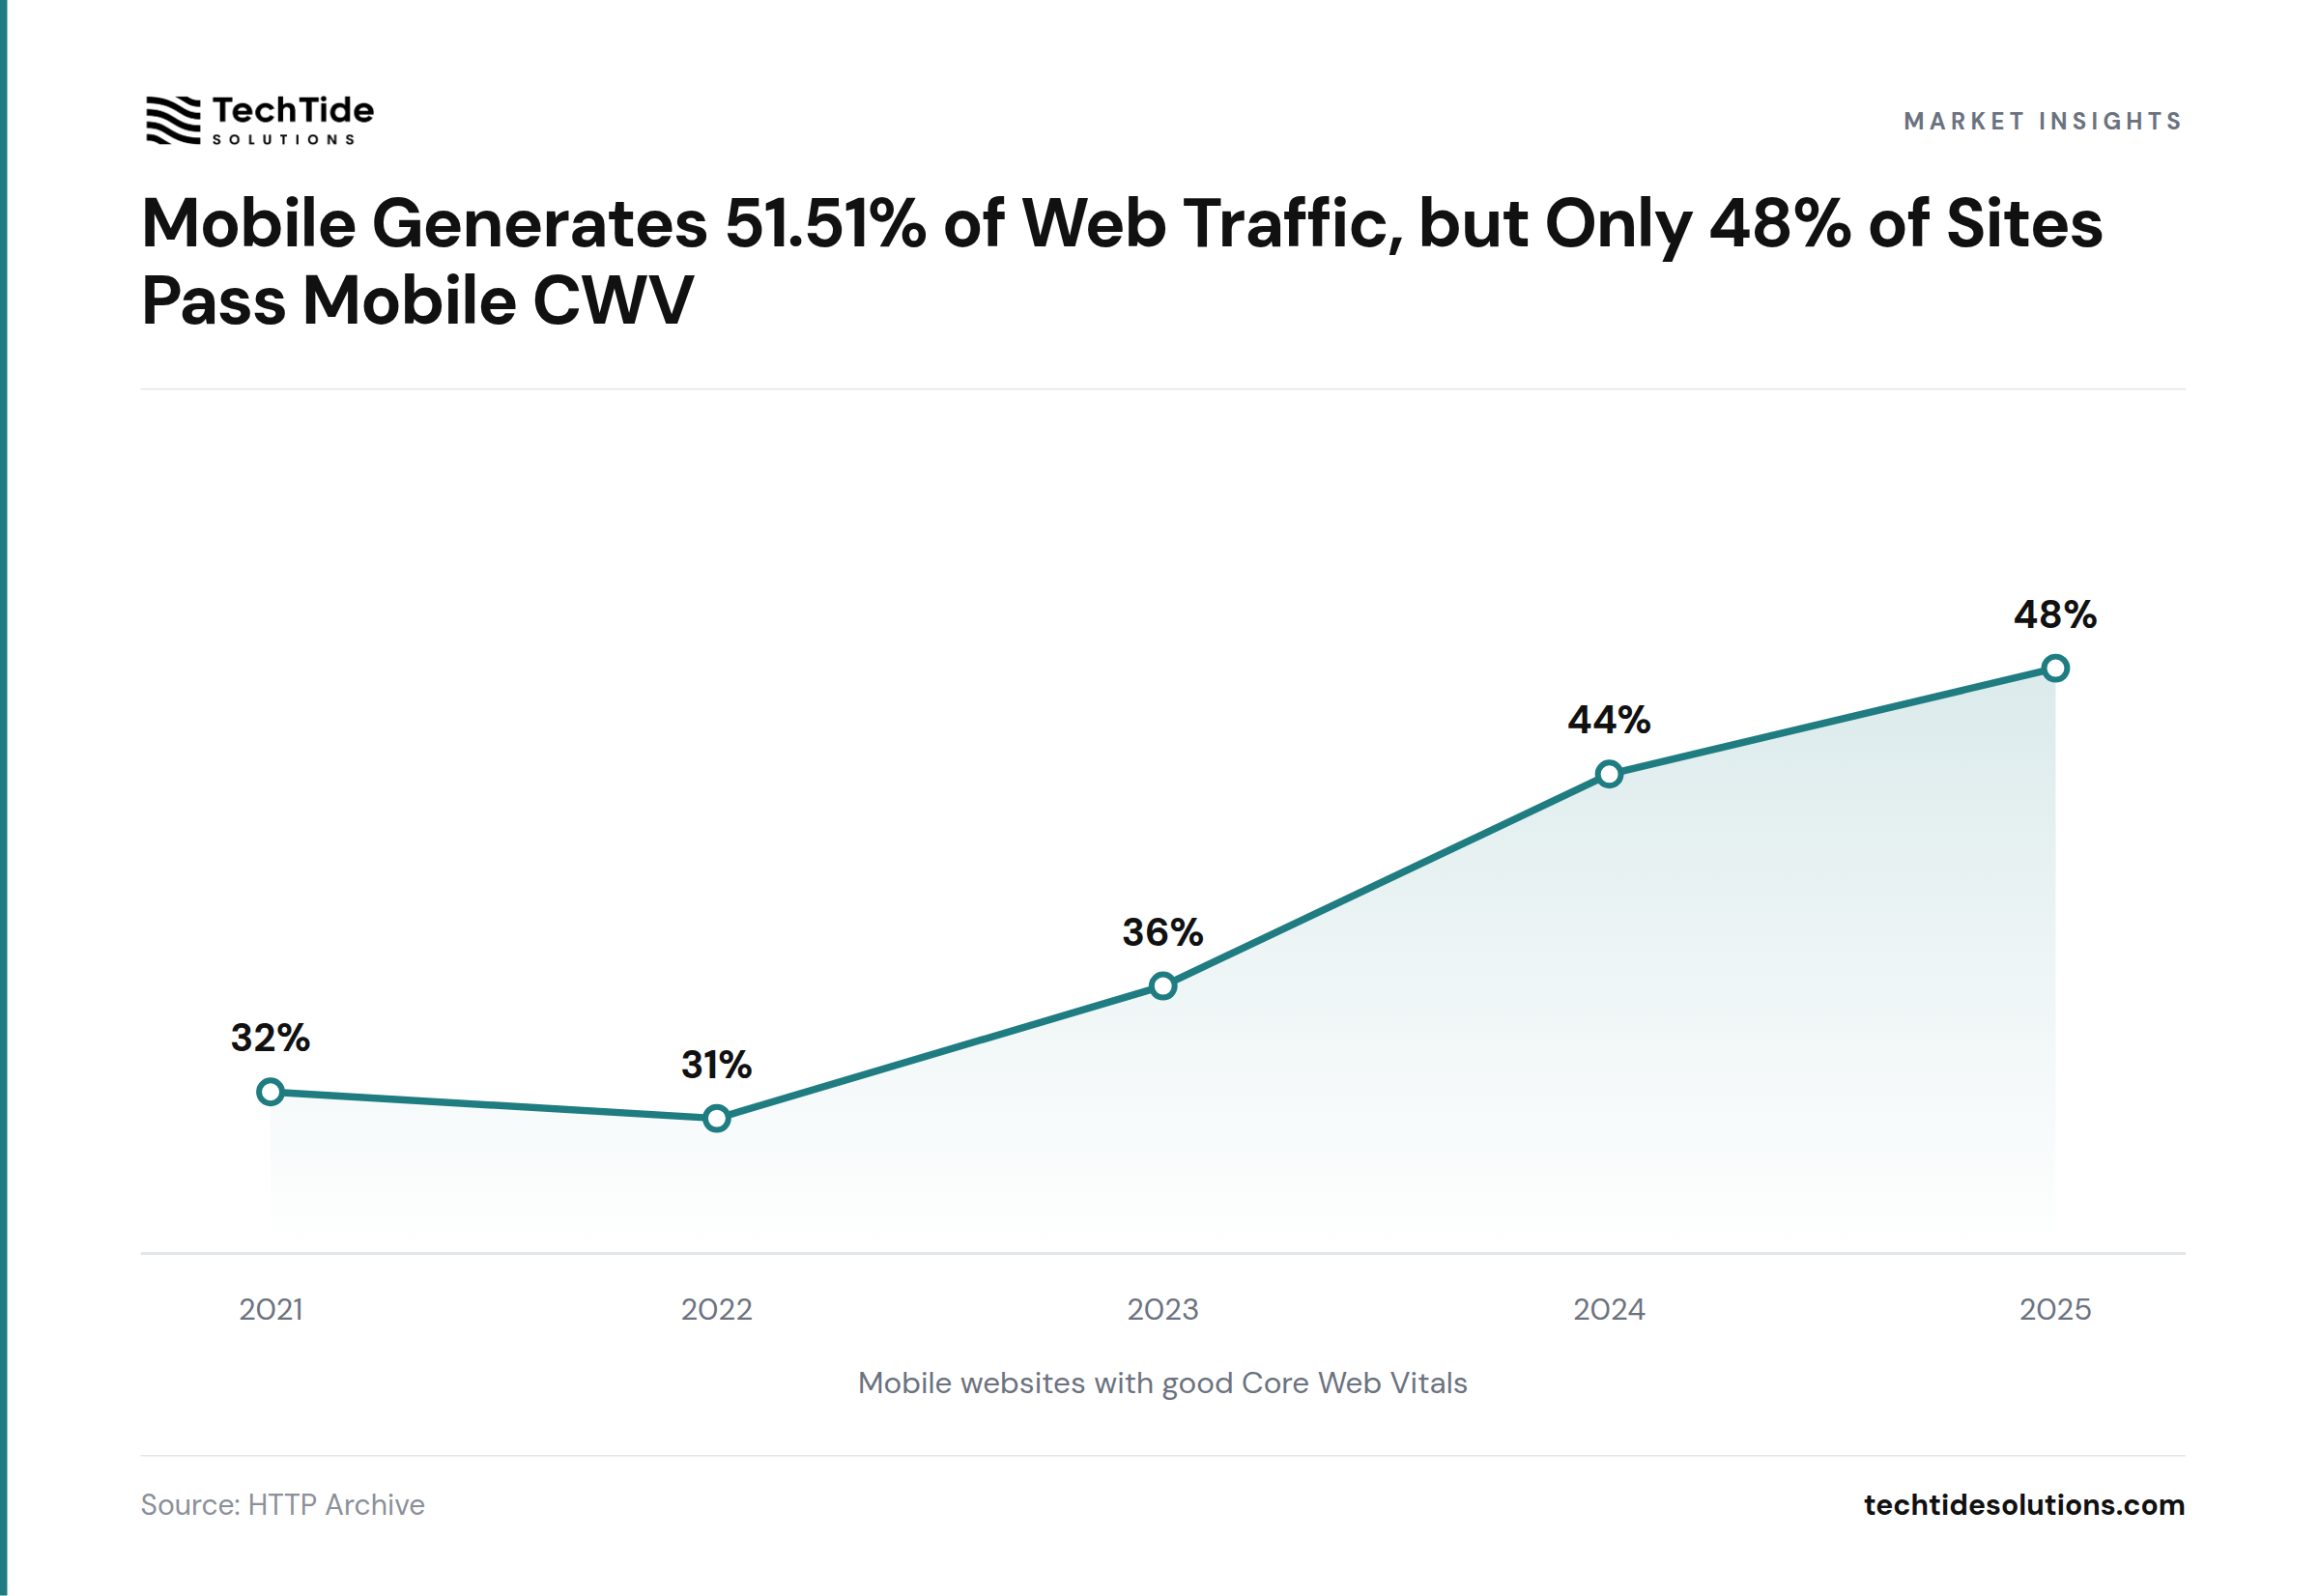
HTTP Archive’s latest Web Almanac finds that only 48% of mobile websites achieved good overall Core Web Vitals in 2025, while 62% had good LCP, 77% had good INP, and 81% had good CLS (HTTP Archive, The Web Almanac 2025: Performance). That mix says the mobile bottleneck is still loading, not visual stability or raw interaction latency.
| Metric | Value | Source |
|---|---|---|
| Mobile websites with good Core Web Vitals, 2021 | 32% | HTTP Archive, The Web Almanac 2025: Performance |
| Mobile websites with good Core Web Vitals, 2022 | 31% | HTTP Archive, The Web Almanac 2025: Performance |
| Mobile websites with good Core Web Vitals, 2023 | 36% | HTTP Archive, The Web Almanac 2025: Performance |
| Mobile websites with good Core Web Vitals, 2024 | 44% | HTTP Archive, The Web Almanac 2025: Performance |
| Mobile websites with good Core Web Vitals, 2025 | 48% | HTTP Archive, The Web Almanac 2025: Performance |
Desktop still outperforms mobile on overall CWV, 56% versus 48%, even though mobile now leads traffic. That mismatch is one of the clearest web development statistics in 2026, because it shows where user demand and developer execution still diverge (HTTP Archive, The Web Almanac 2025: Performance).
Takeaway: If a team can only fund one technical quality push, mobile LCP is still the highest-leverage target.
Recommended reading: SaaS Statistics 2026: 26+ Key Findings on Revenue, AI, and App Sprawl
WordPress Runs 41.5% of the Web, While Closed Platforms Lead on Speed
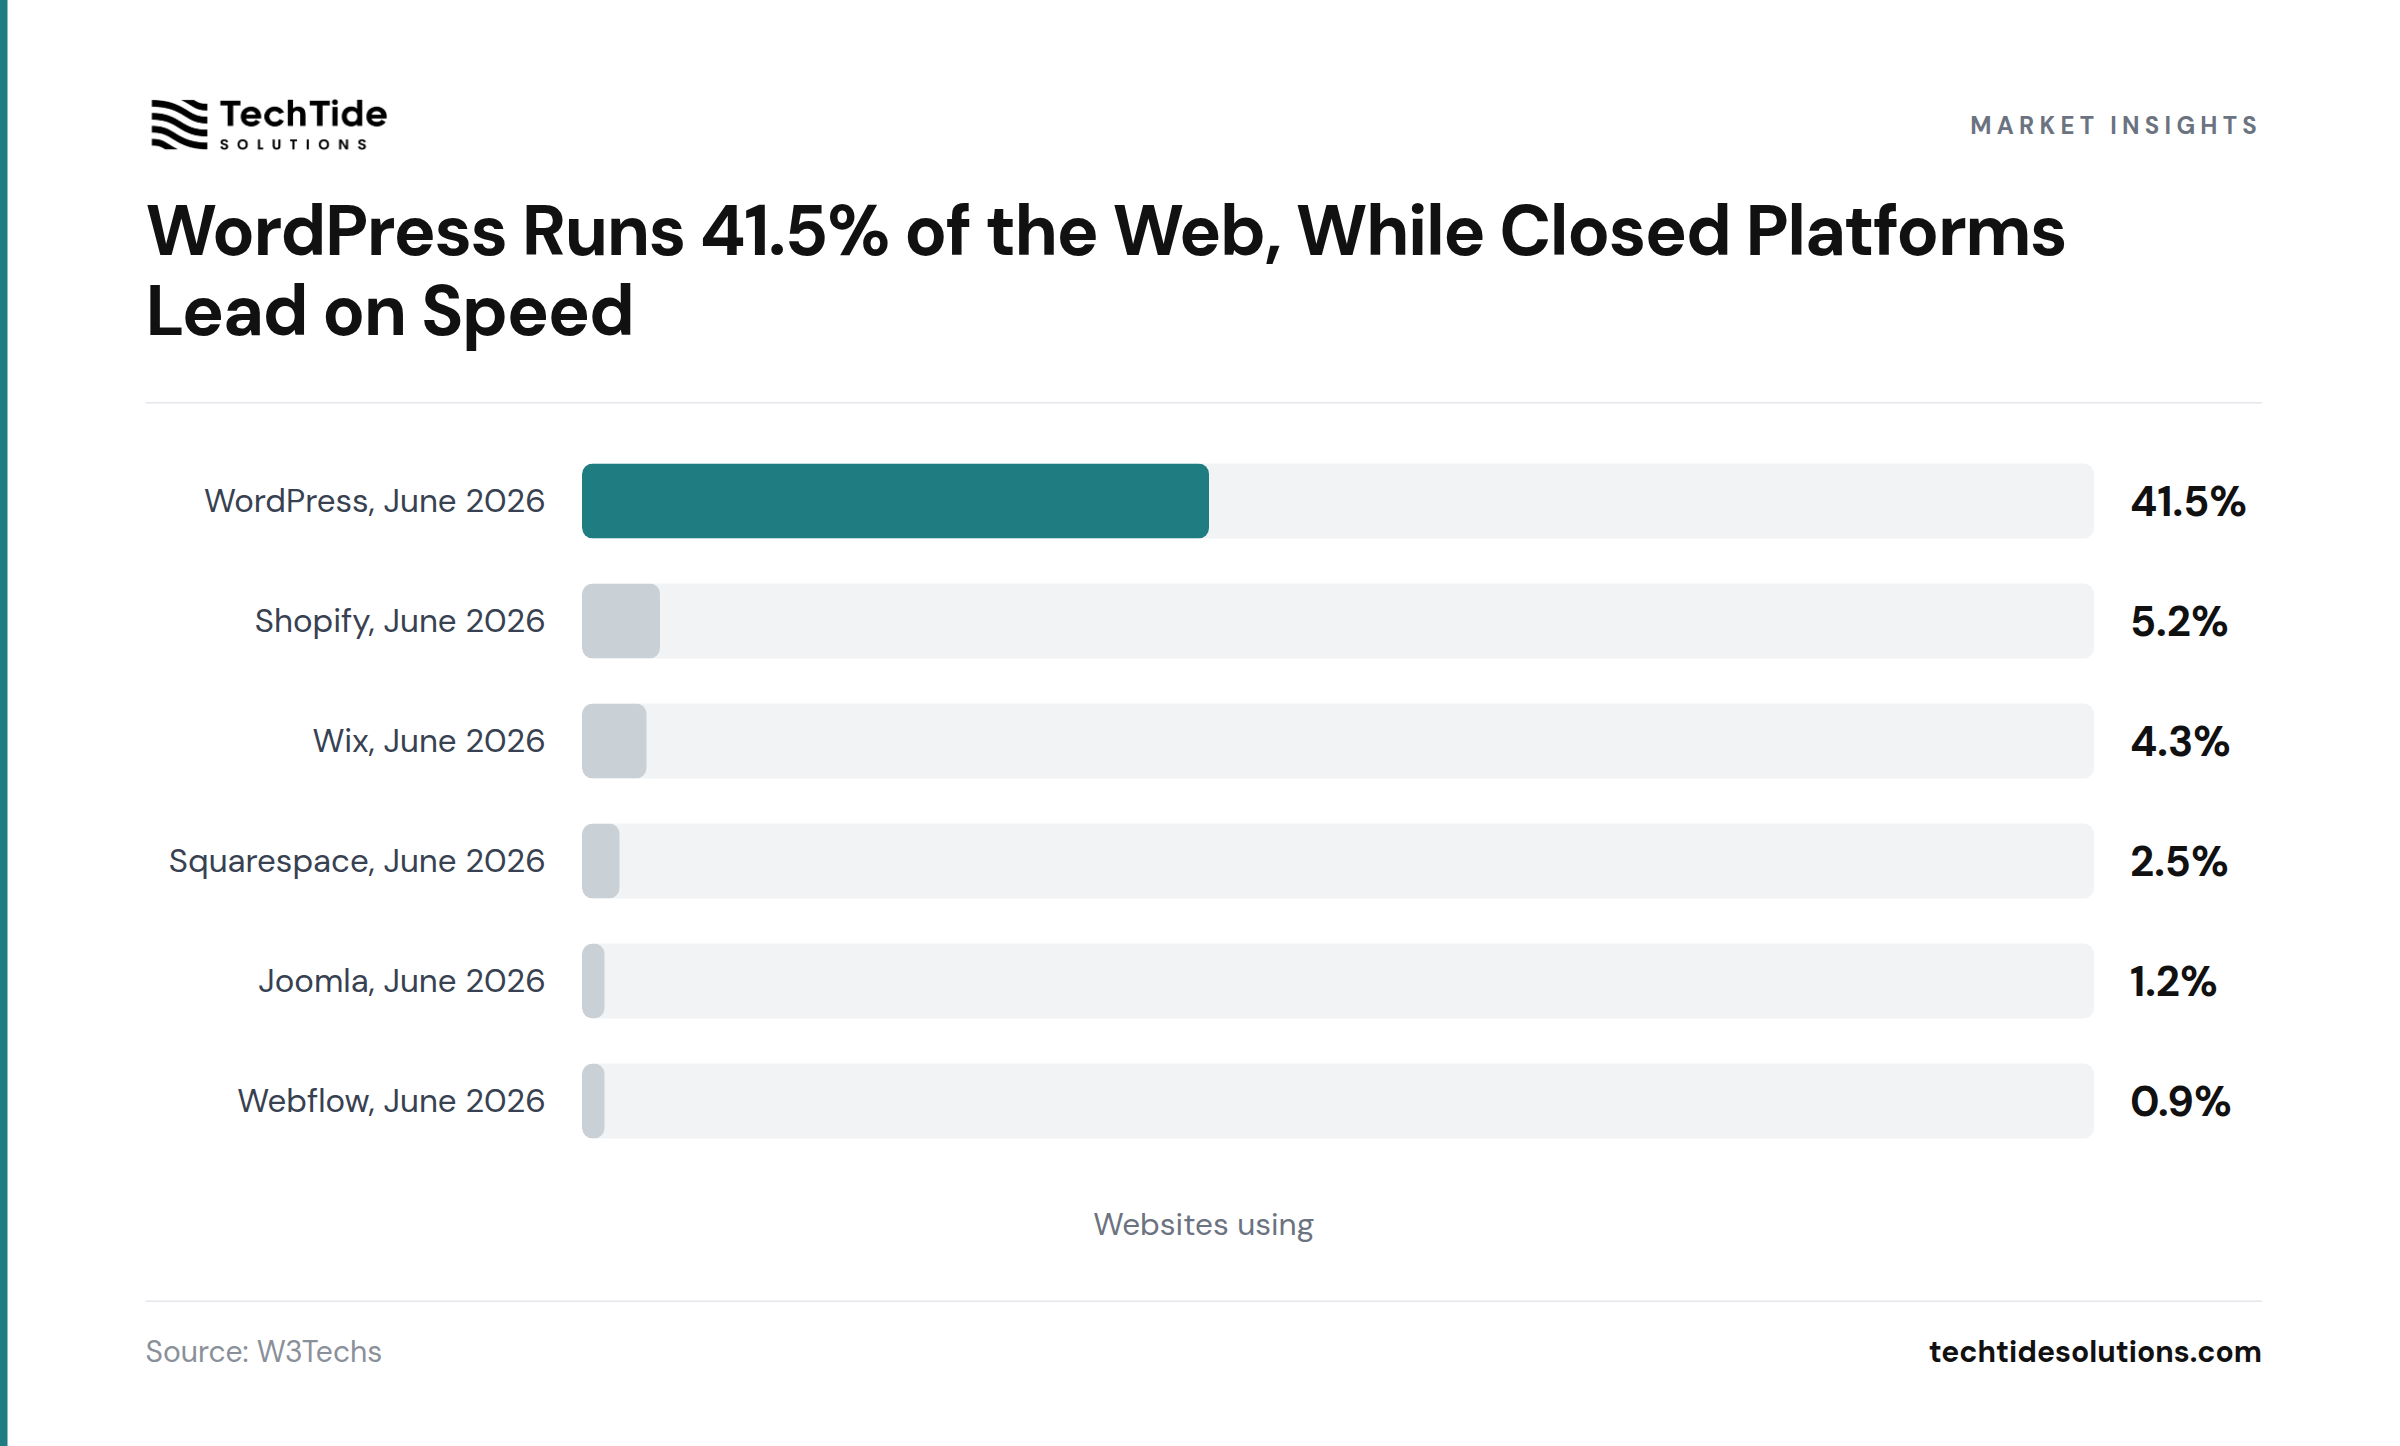
WordPress is used by 41.5% of all websites and holds 59.2% market share among sites with a known CMS as of June 2026 (W3Techs, Usage Statistics and Market Share of Content Management Systems, June 2026). The web is not fragmented at the top level. It is concentrated, and that concentration shapes agency work, plugin ecosystems, hosting, security, and hiring.
That market lead does not make WordPress the performance leader. In HTTP Archive’s 2025 CMS chapter, Duda leads mobile CWV at 85%, Wix reaches 74%, WordPress sits at 45%, and Weebly falls to 47% (HTTP Archive, The Web Almanac 2025: CMS). That is a reminder that scale and speed are separate questions.
| Metric | Value | Source |
|---|---|---|
| Websites using WordPress, June 2026 | 41.5% | W3Techs |
| Websites using Shopify, June 2026 | 5.2% | W3Techs |
| Websites using Wix, June 2026 | 4.3% | W3Techs |
| Websites using Squarespace, June 2026 | 2.5% | W3Techs |
| Websites using Joomla, June 2026 | 1.2% | W3Techs |
| Websites using Webflow, June 2026 | 0.9% | W3Techs |
One more caveat changes how this data should be read. W3Techs measures what is live on the public web, while HTTP Archive measures how real sites perform, so WordPress’s dominance tells you where the work is, not how optimized the average implementation is.
Takeaway: Platform choice sets your defaults, but implementation quality still decides whether a site feels fast.
JavaScript Reaches 98.9% of Websites, Yet Developer Preferences Look Different
JavaScript is used by 98.9% of all websites in W3Techs’ latest usage data (W3Techs, Usage Statistics of JavaScript as Client-side Programming Language on Websites, June 2026). That makes JavaScript less a trend than a baseline layer of the modern web. The interesting question in 2026 is not whether JavaScript matters, but which abstractions sit on top of it.
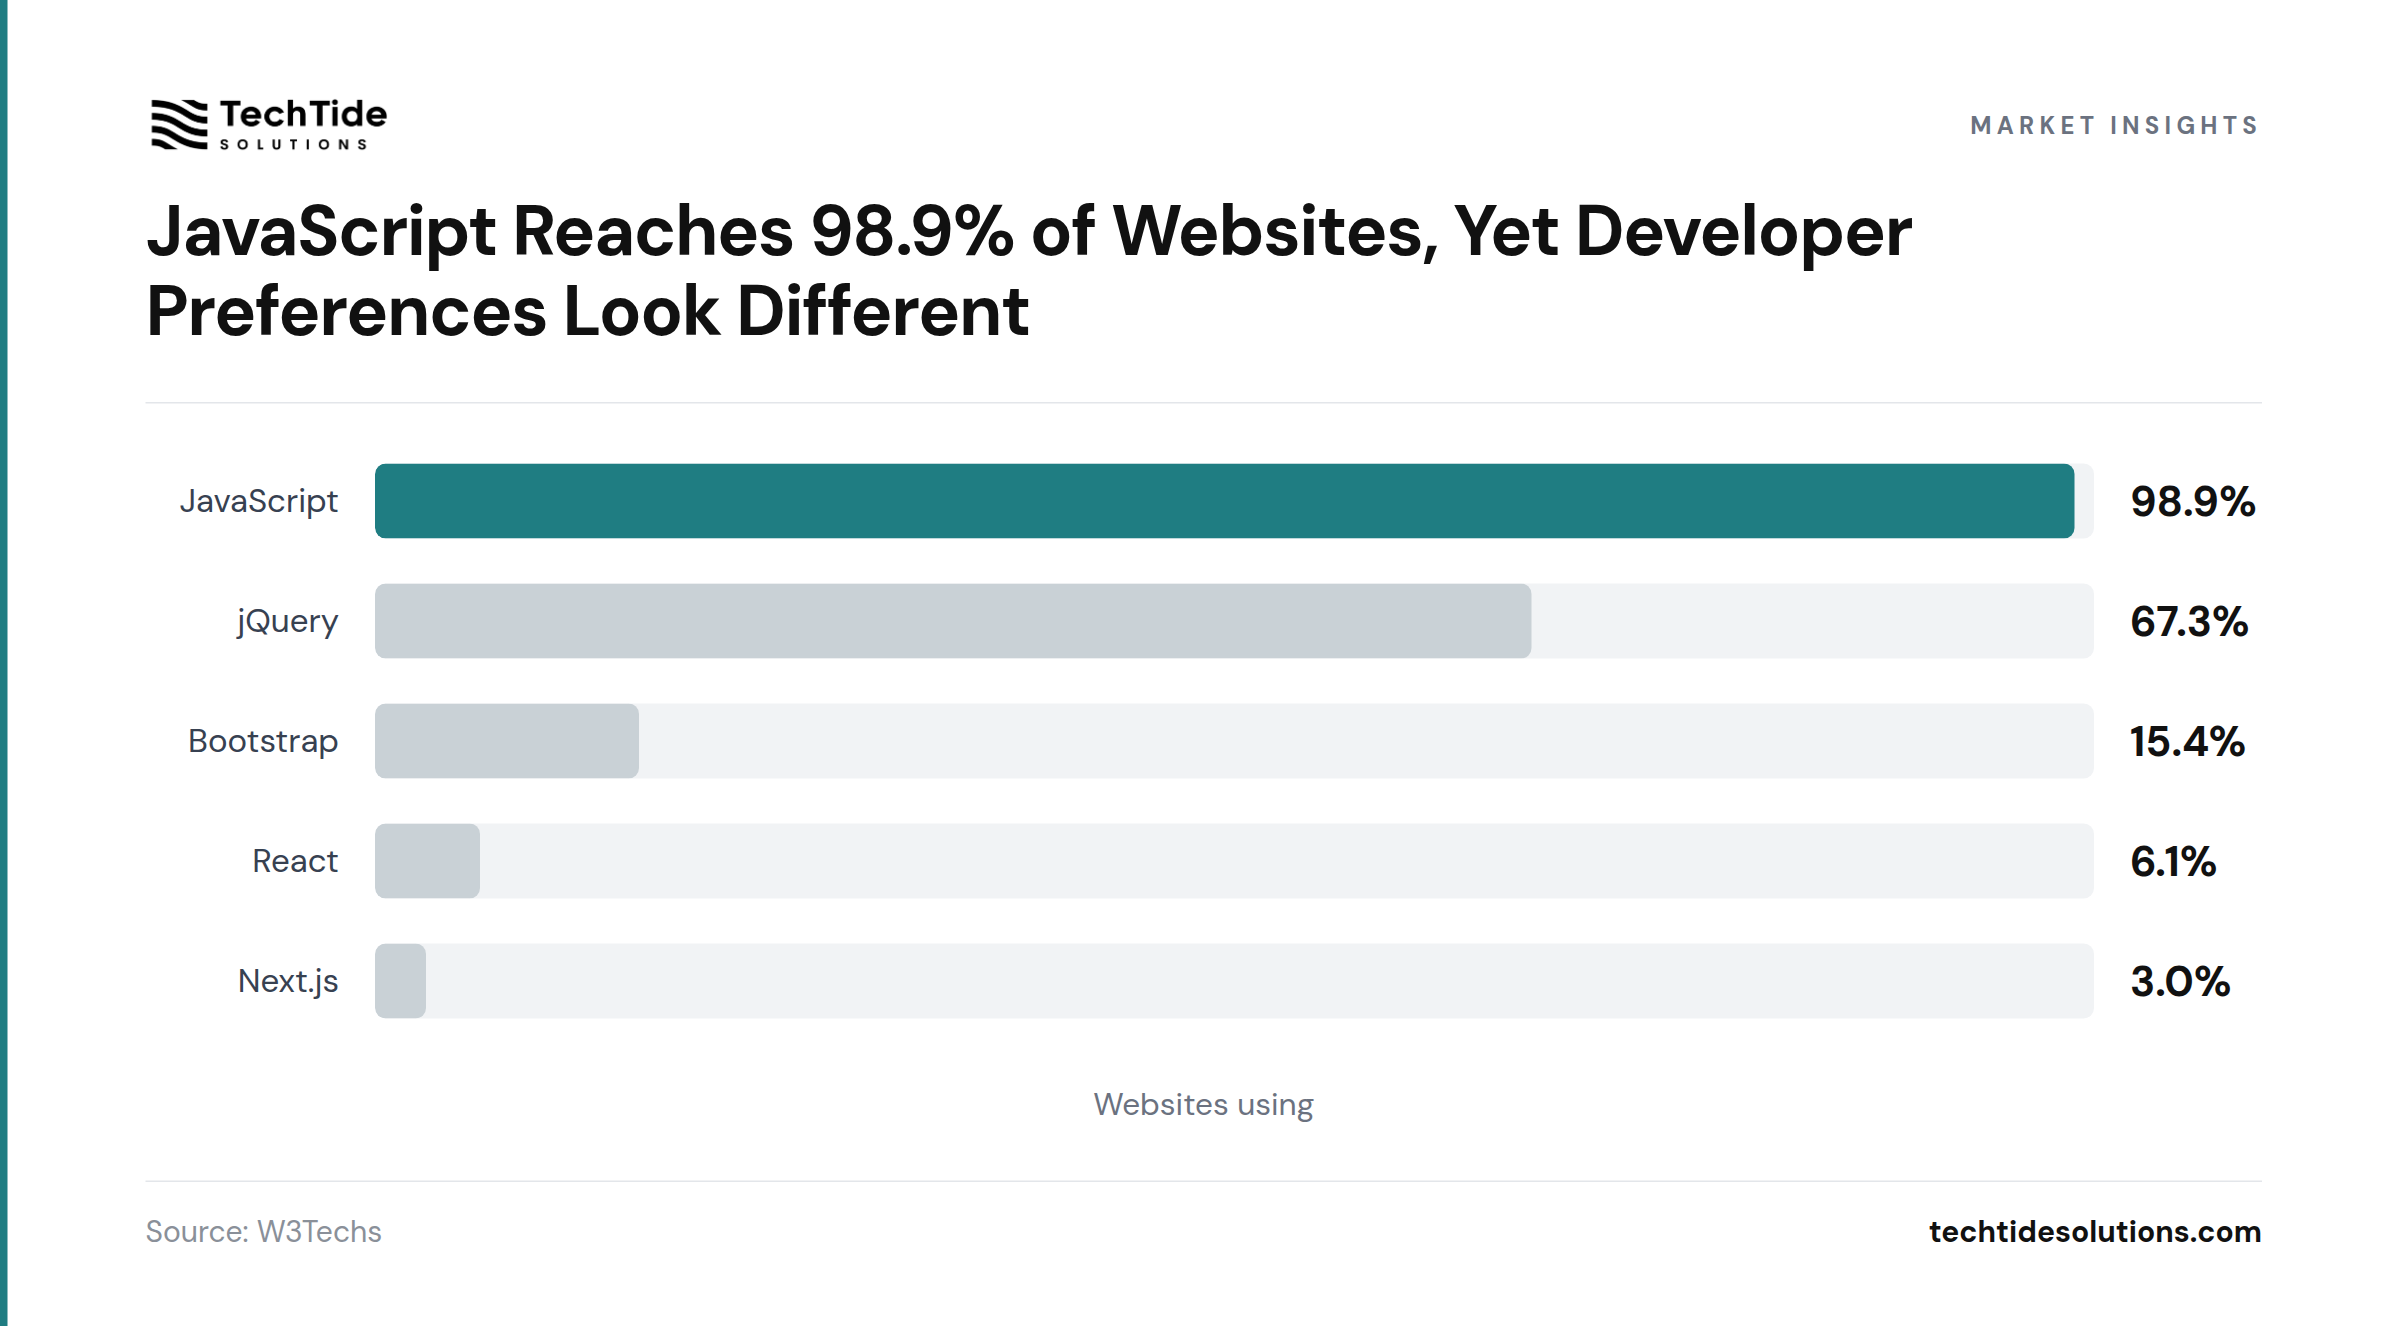
On the live web, older and broader tools still dominate: jQuery appears on 67.3% of websites, Bootstrap on 15.4%, React on 6.1%, and Next.js on 3.0% (W3Techs, Usage Statistics and Market Share of JavaScript Libraries for Websites, July 2026). Among professional developers in Stack Overflow’s 2025 survey, the picture is much more current: 68.8% say they used JavaScript, 48.8% TypeScript, 49.1% Node.js, and 46.9% React, which leaves a 40.8-point gap between React’s developer usage and its footprint on the public web (Stack Overflow, 2025 Stack Overflow Developer Survey: Technology).
| Metric | Value | Source |
|---|---|---|
| Websites using JavaScript | 98.9% | W3Techs, JavaScript usage |
| Websites using jQuery | 67.3% | W3Techs, JavaScript libraries |
| Websites using Bootstrap | 15.4% | W3Techs, JavaScript libraries |
| Websites using React | 6.1% | W3Techs, JavaScript libraries |
| Websites using Next.js | 3.0% | W3Techs, JavaScript libraries |
AI is changing how developers use these tools, but not removing the need for judgment. Among Stack Overflow’s 2025 survey respondents, 29% of professional developers say AI tools struggle with complex tasks, and 75% say they would still ask a person for help when they do not trust AI’s answers (Stack Overflow, 2025 Stack Overflow Developer Survey: AI).
Takeaway: Build for the web people actually run, not just the stack developers say they admire.
95.9% of Home Pages Still Fail Basic Accessibility Checks
95.9% of the top one million home pages had detectable WCAG 2 failures in 2026 (WebAIM, The WebAIM Million 2026). Accessibility remains one of the clearest quality gaps on the web. The troubling part is not just how high the failure rate is, but that the 2026 report reversed the small improvements seen before it.
WebAIM also found an average of 56.1 detectable errors per page, with page complexity rising to 1,437 elements per home page, up 22.5% in one year (WebAIM, The WebAIM Million 2026). Complexity is not the only cause of accessibility problems, but this is one of the strongest signals that teams are shipping more moving parts than they are reliably testing.
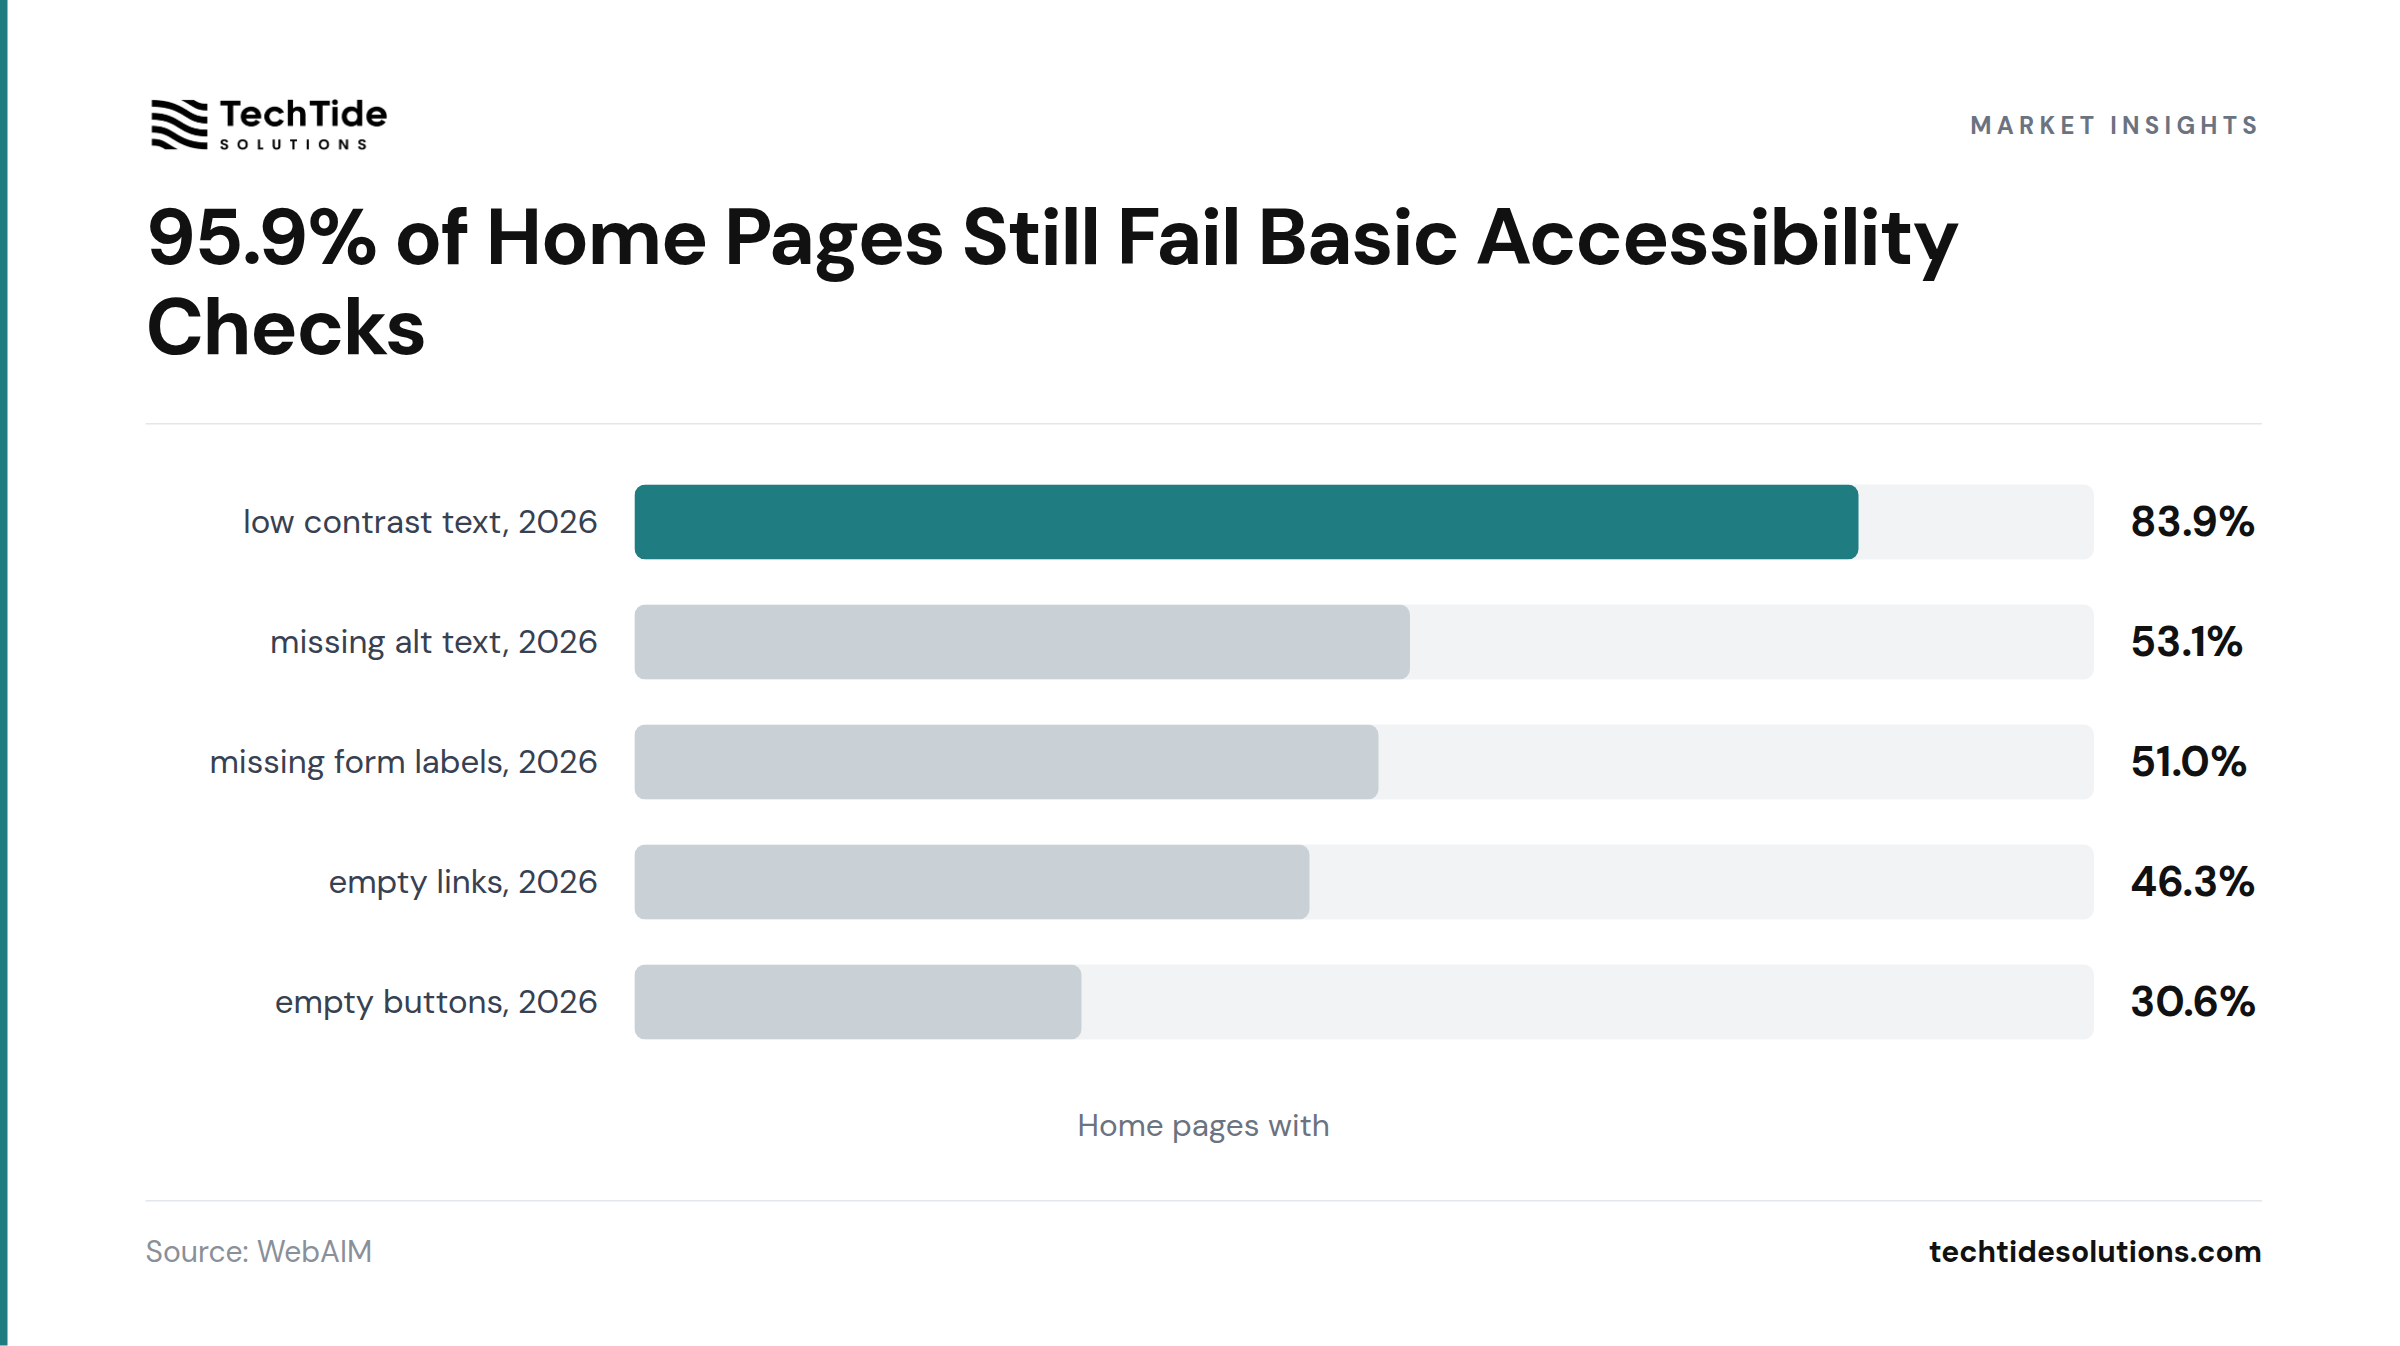
| Metric | Value | Source |
|---|---|---|
| Home pages with low contrast text, 2026 | 83.9% | WebAIM |
| Home pages with missing alt text, 2026 | 53.1% | WebAIM |
| Home pages with missing form labels, 2026 | 51.0% | WebAIM |
| Home pages with empty links, 2026 | 46.3% | WebAIM |
| Home pages with empty buttons, 2026 | 30.6% | WebAIM |
Low contrast text alone appears on 83.9% of home pages, which means the most common accessibility issue is also one of the most avoidable (WebAIM, The WebAIM Million 2026).
Takeaway: Accessibility is still less a hard-edge niche problem than a routine production discipline problem.
What the Numbers Disagree About
React Looks Bigger to Developers Than It Does on the Public Web
Among professional developers in Stack Overflow’s 2025 survey, 46.9% say they used React, while W3Techs sees React on 6.1% of public websites. That is not a contradiction so much as a scope gap. Stack Overflow measures people and multi-project experience, while W3Techs measures live public sites, including legacy properties and long-tail small business websites.
Most Headline Figures Come From 2026 Releases, but the Labor Baseline Is Older
The freshest evidence in this article comes from 2026 releases such as StatCounter’s June 2026 platform share, W3Techs’ June and July 2026 technology pages, HTTP Archive’s Web Almanac 2025 published in January 2026, and WebAIM’s 2026 report. The older numbers mainly come from the 2025 BLS handbook and Stack Overflow’s 2025 survey, which were necessary because there is no equivalent 2026 labor handbook or 2026 developer survey yet.
Telemetry, Surveys, and Projections Answer Different Questions
HTTP Archive, WebAIM, StatCounter, and W3Techs measure live pages or observed traffic, so they are strongest for describing what the web actually looks like. Stack Overflow measures what its survey respondents report about their own work, and BLS models how U.S. jobs may change over a decade. The figure in this article I would treat with the most caution is the 45% remote share, because it reflects U.S. respondents in Stack Overflow’s survey, not a census of all web development jobs.
Web Development Statistics: Summary Table
| Metric | Value | Source |
|---|---|---|
| Home pages with detectable WCAG 2 failures, 2026 | 95.9% | WebAIM |
| Average detectable accessibility errors per home page, 2026 | 56.1 | WebAIM |
| Worldwide web traffic from mobile, June 2026 | 51.51% | StatCounter |
| Worldwide web traffic from desktop, June 2026 | 47.12% | StatCounter |
| Websites using WordPress, June 2026 | 41.5% | W3Techs |
| WordPress share of known CMS market, June 2026 | 59.2% | W3Techs |
| Mobile websites with good Core Web Vitals, 2025 | 48% | HTTP Archive |
| Mobile pages with good Largest Contentful Paint, 2025 | 62% | HTTP Archive |
| Mobile websites with good Interaction to Next Paint, 2025 | 77% | HTTP Archive |
| JavaScript usage across all websites | 98.9% | W3Techs |
| jQuery usage across all websites | 67.3% | W3Techs |
| React usage across all websites | 6.1% | W3Techs |
| Professional developers using React, 2025 survey | 46.9% | Stack Overflow |
| Projected U.S. web role growth, 2024 to 2034 | 7% | BLS |
| Average annual U.S. openings, 2024 to 2034 | 14,500 | BLS |
FAQs
Are web developers still in high demand?
Yes, at least in the U.S. labor data. The Bureau of Labor Statistics projects 7% growth in employment for web developers and digital designers from 2024 to 2034, with about 14,500 openings a year over that period (U.S. Bureau of Labor Statistics, Occupational Outlook Handbook: Web Developers and Digital Designers 2025).
The demand case also shows up on the product side. Mobile already accounts for 51.51% of worldwide web traffic, and WordPress alone powers 41.5% of websites, so businesses still need people to build, maintain, optimize, and redesign web experiences at scale (StatCounter, Mobile vs Tablet vs Desktop Market Share Worldwide – June 2026; W3Techs, Usage Statistics and Market Share of Content Management Systems, June 2026).
Is web dev still worth it in 2026?
For most people choosing between common tech paths, yes. Median annual pay reached $90,930 for web developers and $98,090 for web and digital interface designers in May 2024, and the combined occupation median was $95,380 (U.S. Bureau of Labor Statistics, Occupational Outlook Handbook: Web Developers and Digital Designers 2025).
The stronger case is that web quality is still uneven. Only 48% of mobile sites pass good Core Web Vitals, and 95.9% of top home pages still show detectable WCAG 2 failures, which means there is still a lot of valuable work left to do (HTTP Archive, The Web Almanac 2025: Performance; WebAIM, The WebAIM Million 2026).
Will AI replace web developers in 10 years?
The current data points more toward workflow change than replacement. Among Stack Overflow’s 2025 survey respondents, 84% say they use or plan to use AI tools in their development process, but 29% of professional developers also say AI tools struggle with complex tasks (Stack Overflow, 2025 Stack Overflow Developer Survey: AI).
The most telling stat may be the trust gap. In the same survey, 75% of respondents said they would still ask a person for help when they do not trust AI’s answers, which is a strong sign that verification, architecture, debugging, and accountability still sit with humans (Stack Overflow, 2025 Stack Overflow Developer Survey: AI).
How remote is web development in 2026?
Among Stack Overflow’s 2025 survey respondents in the United States, 45% say they work remotely (Stack Overflow, 2025 Stack Overflow Developer Survey: Work). That is useful directional evidence, though it reflects survey respondents rather than the whole labor market.
The same source also shows that remote work varies by country, so the safest read is that web development remains one of the more location-flexible technical careers, but not a universally remote one (Stack Overflow, 2025 Stack Overflow Developer Survey: Work).
What Changed: 2025 vs 2026
The biggest shift in this year’s Web Development Statistics 2026 roundup is that mobile Core Web Vitals pass rates rose from 43% in the 2025 Web Almanac release to 48% in the 2026 release (HTTP Archive, The Web Almanac 2024: Performance; HTTP Archive, The Web Almanac 2025: Performance). Performance kept moving forward, especially on mobile. Accessibility moved the other way, with average errors per page rising from 51 in the 2025 WebAIM Million to 56.1 in the 2026 edition (WebAIM, The WebAIM Million 2025; WebAIM, The WebAIM Million 2026).
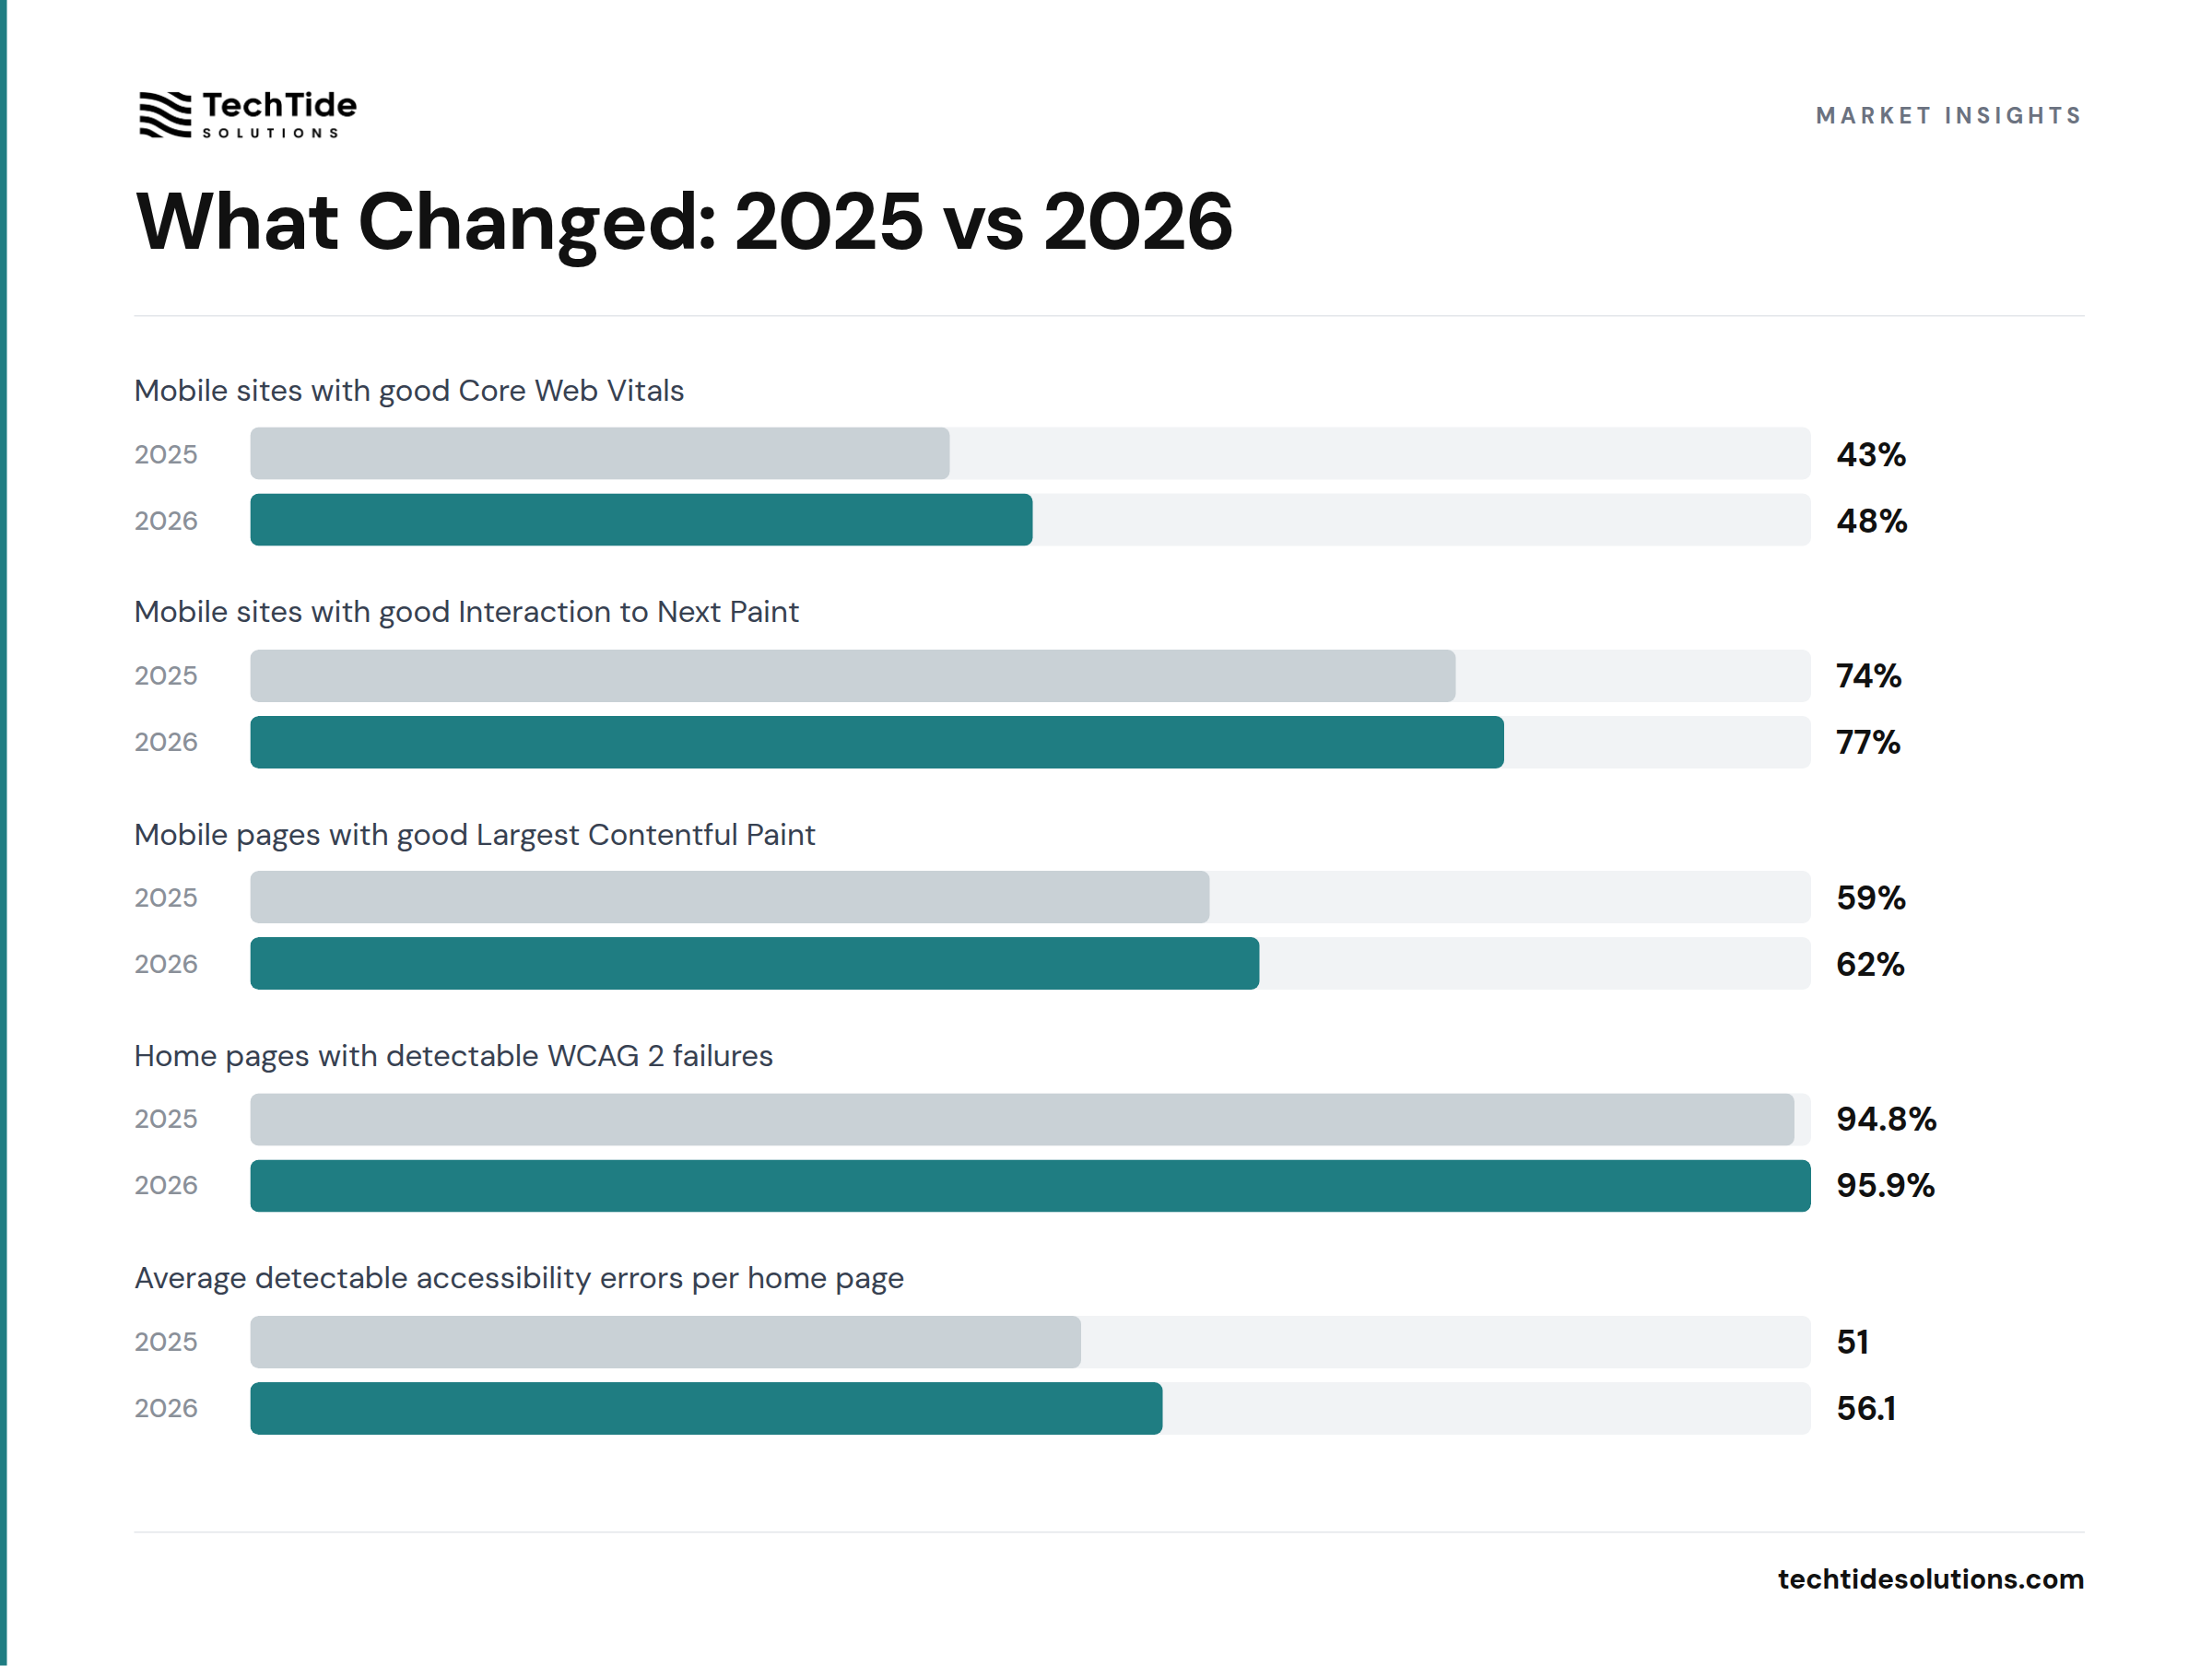
| Metric | 2025 | 2026 | Change |
|---|---|---|---|
| Mobile sites with good Core Web Vitals (HTTP Archive, The Web Almanac 2024: Performance; HTTP Archive, The Web Almanac 2025: Performance) | 43% | 48% | ↑ 11.6% |
| Mobile sites with good Interaction to Next Paint (HTTP Archive, The Web Almanac 2024: Performance; HTTP Archive, The Web Almanac 2025: Performance) | 74% | 77% | ↑ 4.1% |
| Mobile pages with good Largest Contentful Paint (HTTP Archive, The Web Almanac 2024: Performance; HTTP Archive, The Web Almanac 2025: Performance) | 59% | 62% | ↑ 5.1% |
| Home pages with detectable WCAG 2 failures (WebAIM, The WebAIM Million 2025; WebAIM, The WebAIM Million 2026) | 94.8% | 95.9% | ↑ 1.2% |
| Average detectable accessibility errors per home page (WebAIM, The WebAIM Million 2025; WebAIM, The WebAIM Million 2026) | 51 | 56.1 | ↑ 10.0% |
Accelerating: Mobile CWV Pass Rates Rose 5 Points
Mobile sites with good overall Core Web Vitals moved from 43% in the 2025 Web Almanac release to 48% in the 2026 release (HTTP Archive, The Web Almanac 2024: Performance; HTTP Archive, The Web Almanac 2025: Performance). The likeliest driver is cumulative improvement across browsers, devices, and routine optimization work. If that continues, mobile quality should keep rising into 2027.
Decelerating: INP Improved More Slowly Than Overall CWV
Mobile INP improved from 74% to 77% across the same HTTP Archive releases (HTTP Archive, The Web Almanac 2024: Performance; HTTP Archive, The Web Almanac 2025: Performance). The likely reason is that interaction latency gets harder to improve once the easy wins are gone and JavaScript-heavy sites remain complex. Into 2027, I would expect smaller gains here than on simpler loading metrics.
Stalled: Mobile LCP Still Tops Out at 62%
Mobile pages with good LCP rose from 59% in the 2025 release to 62% in the 2026 release (HTTP Archive, The Web Almanac 2024: Performance; HTTP Archive, The Web Almanac 2025: Performance). That is improvement, but it still leaves loading speed as the main reason many sites fail good CWV on phones. Unless teams cut payloads and prioritize above-the-fold content more aggressively, LCP will stay the drag into 2027.
Reversing: Accessibility Errors Climbed Back to 56.1 per Page
Average detectable accessibility errors rose from 51 in WebAIM’s 2025 report to 56.1 in its 2026 report, while the share of pages with detectable WCAG 2 failures rose from 94.8% to 95.9% (WebAIM, The WebAIM Million 2025; WebAIM, The WebAIM Million 2026). The likeliest driver is growing page complexity, which WebAIM says increased 22.5% year over year. If complexity keeps rising faster than QA discipline, accessibility will stay under pressure in 2027.
The shift to watch most closely into 2027 is the accessibility reversal, because rising complexity can erase the gains developers are making on speed.
Methodology and Sources
This roundup prioritizes primary sources, including official labor data, open web measurement projects, and first-party survey publications. Independent datasets from BLS, StatCounter, HTTP Archive, W3Techs, and WebAIM carry the headline market, traffic, performance, and accessibility numbers. Stack Overflow survey data is used for developer workflow and sentiment, and its scope is labeled in the sentence itself because it reflects survey respondents rather than the entire industry. For this report we ran 29 targeted searches across 8 domains and kept 6 sources that publish accessible, traceable data. We favored 2026 and 2025 releases, and we kept older figures only when they were the latest official baseline or required for year-over-year comparison. We also separated telemetry, surveys, and projections in the analysis because those methods answer different questions. Where two sources measured similar themes differently, the article names the scope difference instead of forcing a false single number.
- U.S. Bureau of Labor Statistics, Occupational Outlook Handbook: Web Developers and Digital Designers 2025
- StatCounter, Mobile vs Tablet vs Desktop Market Share Worldwide – June 2026
- HTTP Archive, The Web Almanac 2025: Performance
- HTTP Archive, The Web Almanac 2024: Performance
- HTTP Archive, The Web Almanac 2025: CMS
- W3Techs, Usage Statistics and Market Share of Content Management Systems, June 2026
- W3Techs, Usage Statistics of JavaScript as Client-side Programming Language on Websites, June 2026
- W3Techs, Usage Statistics and Market Share of JavaScript Libraries for Websites, July 2026
- WebAIM, The WebAIM Million 2026
- WebAIM, The WebAIM Million 2025
- Stack Overflow, 2025 Stack Overflow Developer Survey: Work
- Stack Overflow, 2025 Stack Overflow Developer Survey: AI
- Stack Overflow, 2025 Stack Overflow Developer Survey: Technology
Last updated: July 2026
We refresh this page as new data becomes available.

