


Worldwide SaaS revenue is projected to reach US$488.53 billion in 2026 (Statista, Software as a Service – Worldwide 2026). The United States alone is projected to account for US$254.94 billion of that total in 2026, which keeps it far ahead of any other national market (Statista, Software as a Service – Worldwide 2026). At the same time, SaaS adoption is changing shape inside companies, not just growing in a straight line: the average company in Okta’s customer base used 98 apps in the 2026 edition of Businesses at Work, down from 101 in the 2025 edition (Okta, Businesses at Work 2026; Okta, Businesses at Work 2025).
This roundup on SaaS statistics 2026 draws from primary reports, platform telemetry, disclosed surveys, and official research notes rather than blog-to-blog recycling. That matters because SaaS is now being pushed by two forces at once, AI demand and budget discipline. If you want the short version, the market is still expanding, but buyers are getting tougher about which apps stay in the stack.
Key Takeaways
- Global SaaS revenue is projected to reach US$488.53 billion in 2026 (Statista, Software as a Service – Worldwide 2026).
- The United States is projected to generate US$254.94 billion in SaaS revenue in 2026, the largest country market by a wide margin (Statista, Software as a Service – Worldwide 2026).
- Worldwide software spending is forecast to hit US$1.44 trillion in 2026, up 15.1% from 2025 (Gartner, Gartner Forecasts Worldwide IT Spending to Grow 13.5% in 2026, Totaling $6.31 Trillion).
- Among organizations in McKinsey’s 2025 global survey, 88% say they regularly use AI in at least one business function, up from 78% a year earlier (McKinsey, The State of AI in 2025: Agents, Innovation, and Transformation).
- Among Okta’s customer base, the average number of deployed apps slipped from 101 in the 2025 report to 98 in the 2026 report (Okta, Businesses at Work 2025; Okta, Businesses at Work 2026).
- In BetterCloud’s 2026 survey of 525 IT and security professionals at SaaS-first organizations, AI-powered apps already account for 22% of the average portfolio (BetterCloud, The 2026 State of SaaS Report).
- In that same BetterCloud survey, only 56% of apps in use had IT approval (BetterCloud, The 2026 State of SaaS Report).
- In Stack Overflow’s 2025 survey, 84% of respondents say they use or plan to use AI tools in development workflows (Stack Overflow, 2025 Developer Survey).
- Among more than 100 private SaaS companies in KeyBanc’s 2024 survey, expected ARR growth was about 19%, gross retention about 90%, and net retention about 101% (KeyBanc Capital Markets and Sapphire Ventures, Private SaaS Company Survey Reveals Shift Towards Future Growth With a Continued Focus on Operational Efficiency and Profitability).
- In Bessemer’s 2025 Cloud 100 benchmarks, the average revenue multiple fell to 20x from 23x in 2024 and 26x in 2023 (Bessemer Venture Partners, The Cloud 100 Benchmarks Report 2025).
Recommended reading: WordPress Security Statistics 2026: 22+ Findings on Vulnerabilities, Core Fixes, and Malware
SaaS Market Revenue Reaches $488.53 Billion in 2026
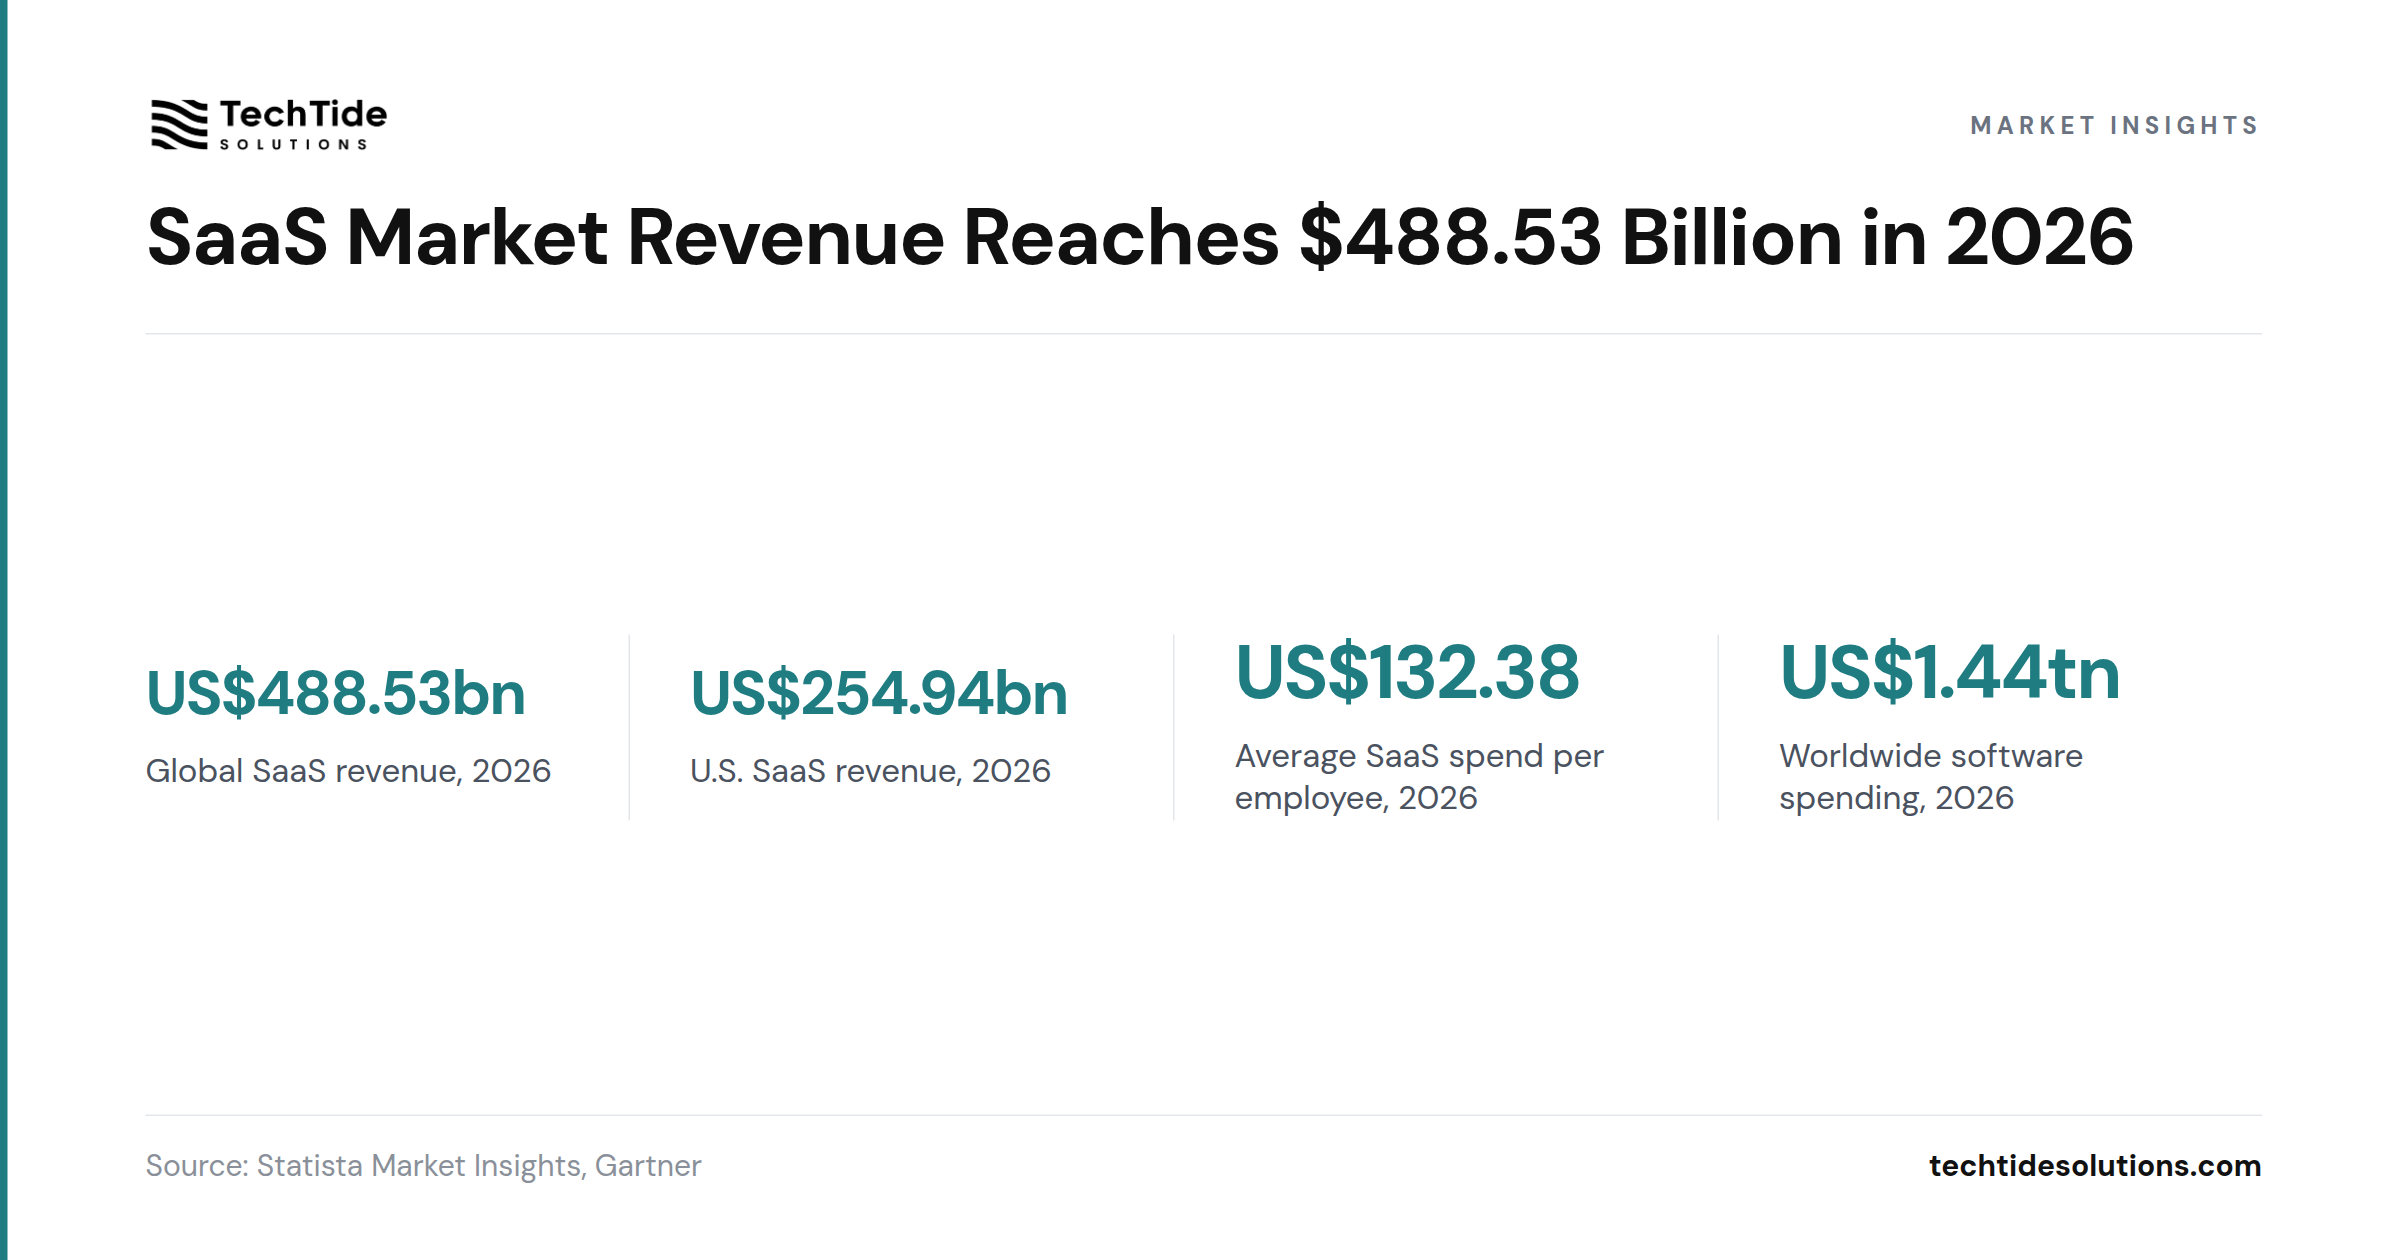
Worldwide SaaS revenue is projected to reach US$488.53 billion in 2026 (Statista, Software as a Service – Worldwide 2026). That is the cleanest top-line number for this keyword, but it is still a model, not a census. The bigger point is that SaaS remains the largest cloud layer by revenue, even as buyers become more selective about renewal, consolidation, and AI add-ons.
| Metric | Value | Source |
|---|---|---|
| Global SaaS revenue, 2026 | US$488.53bn | Statista Market Insights |
| U.S. SaaS revenue, 2026 | US$254.94bn | Statista Market Insights |
| Average SaaS spend per employee, 2026 | US$132.38 | Statista Market Insights |
| Worldwide software spending, 2026 | US$1.44tn | Gartner |
Gartner’s narrower enterprise application SaaS market share note put 2024 worldwide SaaS revenue at US$218.5 billion, while Statista’s broader market model put 2024 SaaS revenue at US$251 billion (Gartner, Market Share: Enterprise Application Software as a Service, Worldwide, 2024; Statista, Software as a Service – Worldwide 2026). That gap does not mean one figure is wrong. It means the scope is different, which is exactly why market-size claims need labels.
Takeaway: If you cite a headline market number, name the model behind it, because SaaS market size changes with the boundary you choose.
Recommended reading: WordPress Usage Statistics 2026: 18+ Findings on Market Share, Versions, and Security
Average App Counts Fell to 98 in 2026, but Sprawl Did Not Disappear
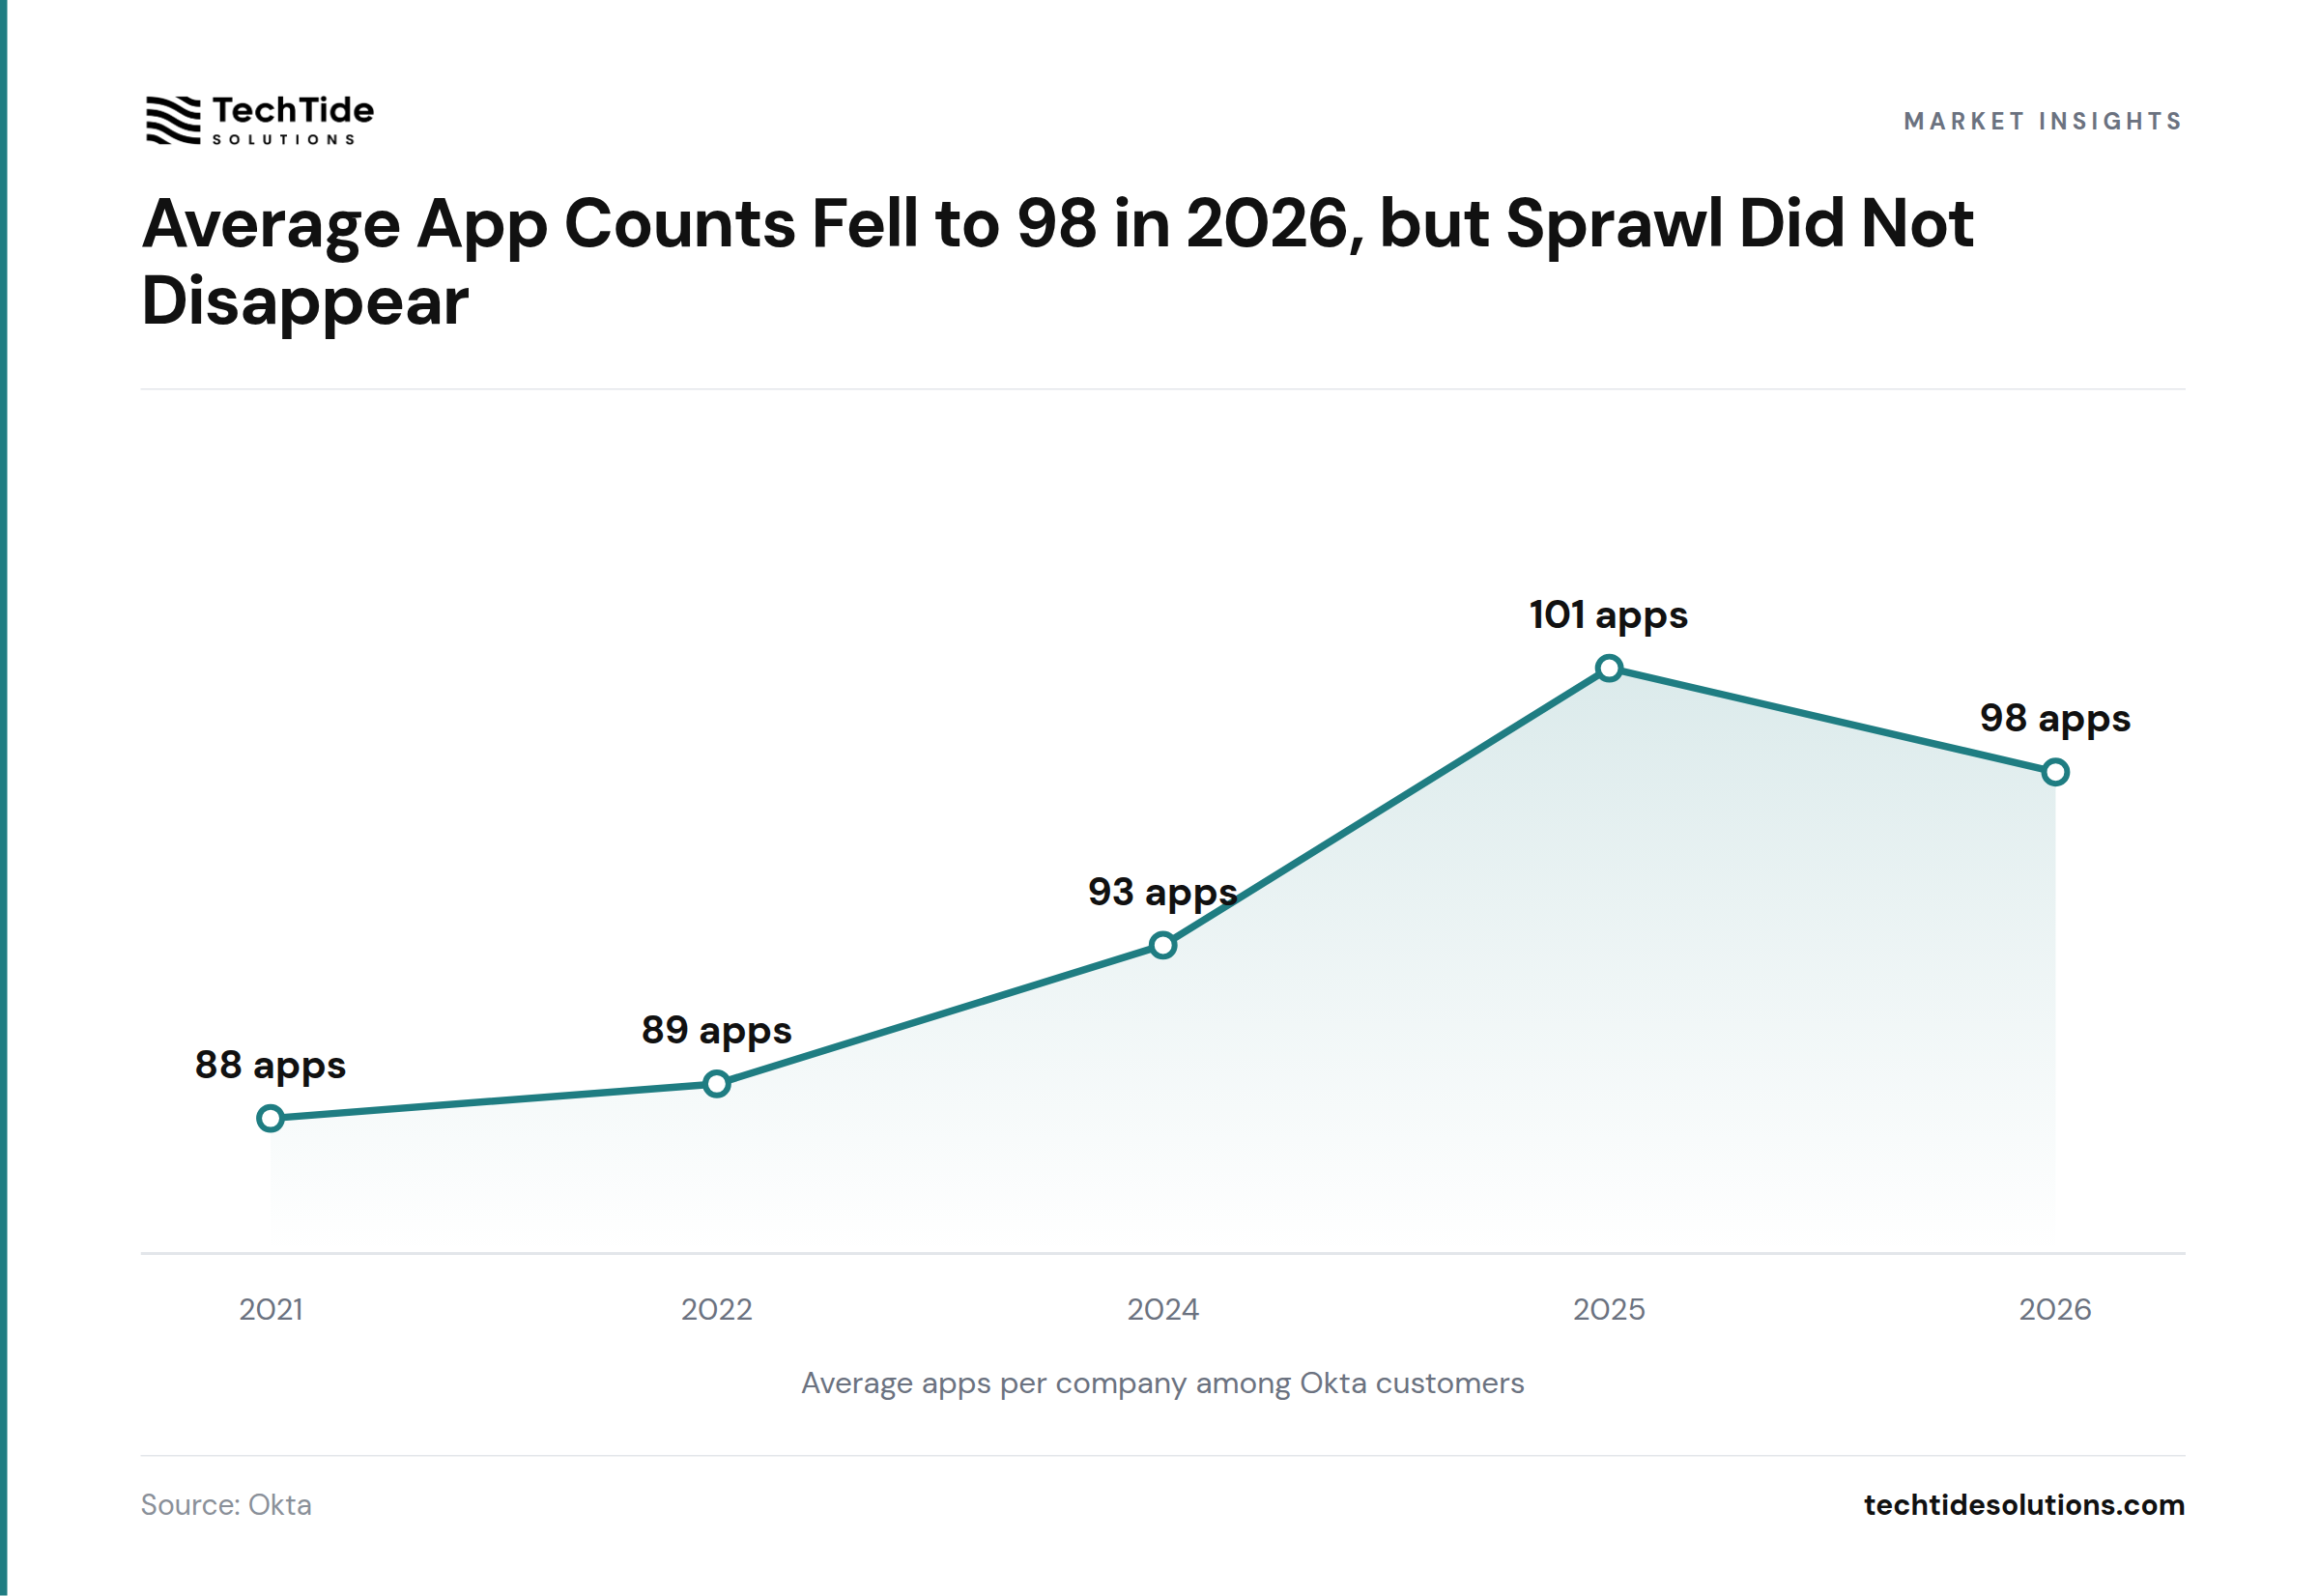
Among Okta’s customer base, the average number of deployed apps per company was 98 in the 2026 edition of Businesses at Work (Okta, Businesses at Work 2026). That sounds like consolidation, and in one narrow sense it is. But it does not mean SaaS management got easier, because different datasets count different things, and AI tools are adding new layers of app discovery, overlap, and expense noise.
| Metric | Value | Source |
|---|---|---|
| Average apps per company among Okta customers, 2021 | 88 apps | Okta |
| Average apps per company among Okta customers, 2022 | 89 apps | Okta |
| Average apps per company among Okta customers, 2024 | 93 apps | Okta |
| Average apps per company among Okta customers, 2025 | 101 apps | Okta |
| Average apps per company among Okta customers, 2026 | 98 apps | Okta |
Vendor datasets disagree sharply on portfolio size. BetterCloud’s 2025 survey put the average organization at 106 SaaS apps, while Productiv says the average portfolio runs 342 apps per customer and that 40% go unused or overlap in functionality, a claim from a SaaS management vendor that benefits from highlighting sprawl (BetterCloud, State of SaaS 2025; Productiv, Why Duplicative SaaS Apps Are Dominating Your Tech Stack 2025).
BetterCloud’s 2026 survey adds the AI angle. In its sample of 525 IT and security professionals, organizations now deploy an average of 27 AI-powered SaaS applications, and those tools make up 22% of the portfolio (BetterCloud, The 2026 State of SaaS Report).
Takeaway: App counts are useful as an internal trend line, not as a universal industry average, because “deployed,” “approved,” and “discovered” apps are not the same thing.
Recommended reading: Web Development Statistics 2026: 20+ Key Findings on Hiring, Speed, CMS, and Accessibility
AI Adoption Is Broad, but SaaS Governance Has Not Caught Up
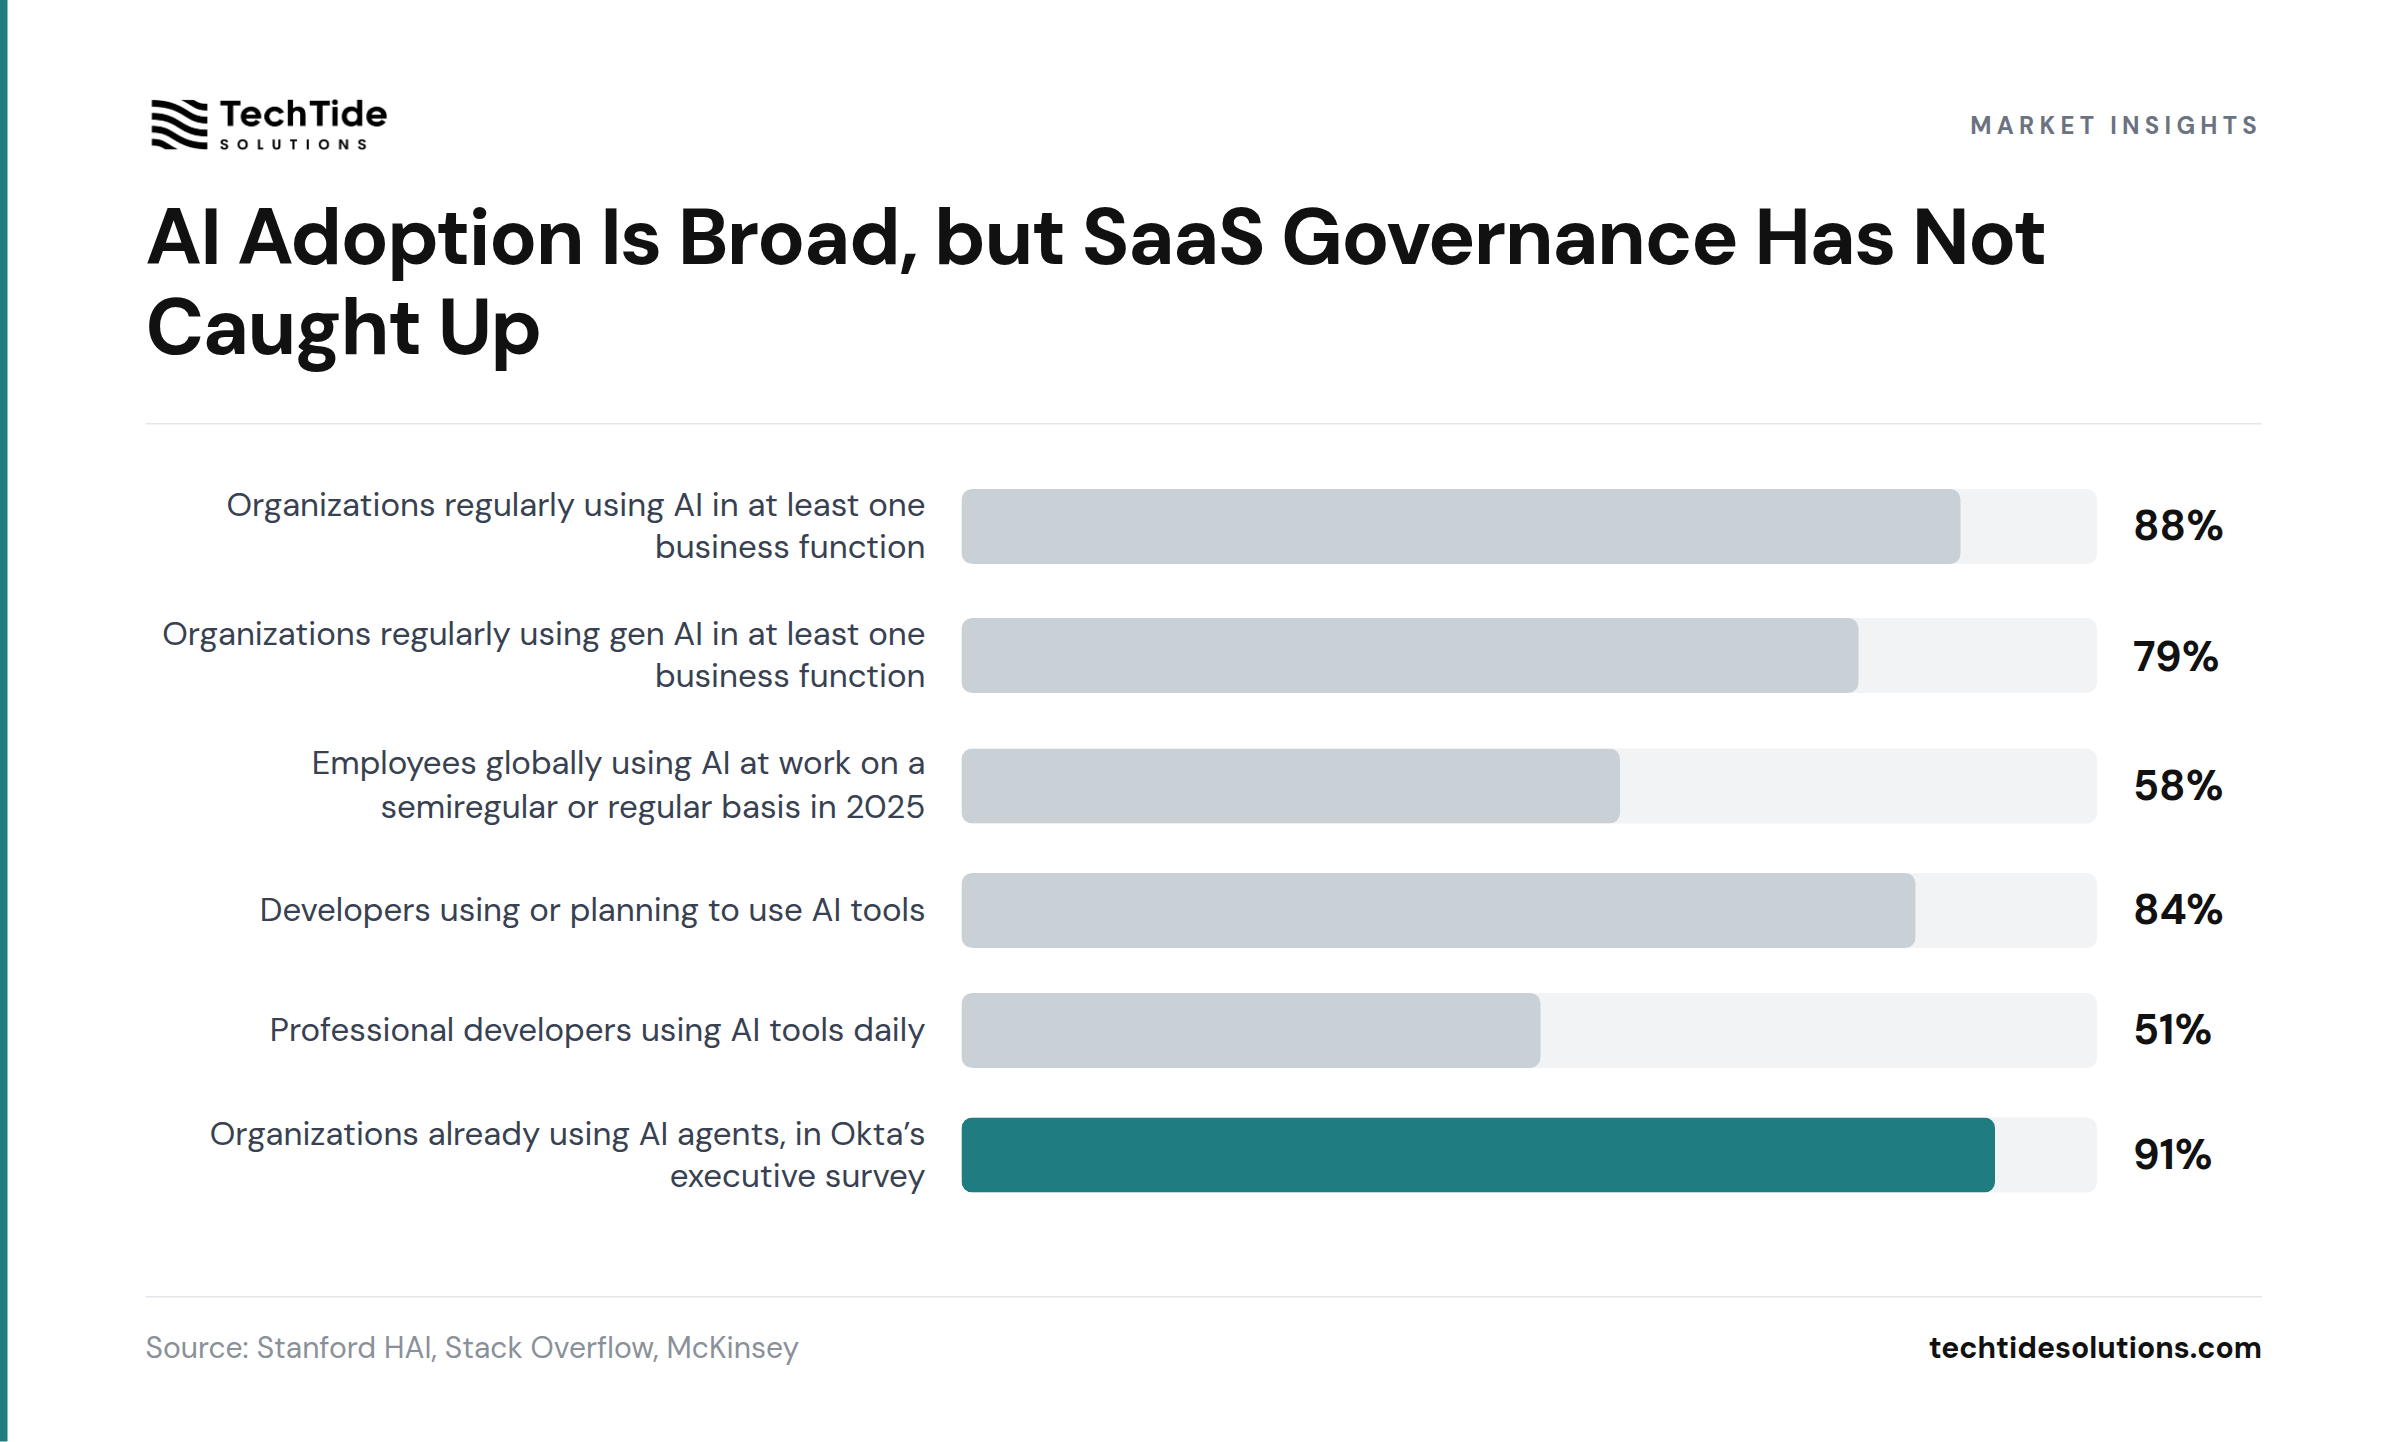
Among organizations in McKinsey’s 2025 global survey, 88% say they regularly use AI in at least one business function (McKinsey, The State of AI in 2025: Agents, Innovation, and Transformation). That matters for SaaS because AI is no longer a side feature. It is becoming part of buying criteria, product road maps, and renewal math across the software stack.
| Metric | Value | Source |
|---|---|---|
| Organizations regularly using AI in at least one business function | 88% | McKinsey |
| Organizations regularly using gen AI in at least one business function | 79% | Stanford HAI |
| Employees globally using AI at work on a semiregular or regular basis in 2025 | 58% | Stanford HAI |
| Developers using or planning to use AI tools | 84% | Stack Overflow |
| Professional developers using AI tools daily | 51% | Stack Overflow |
| Organizations already using AI agents, in Okta’s executive survey | 91% | Okta |
Freshness matters here. Stanford’s 2026 AI Index says 79% of organizations now use generative AI in at least one business function, up from 71% in 2024, while its Adoption Monitor says 58% of employees globally were using AI at work at the beginning of 2026 (Stanford HAI, The 2026 AI Index Report; Stanford Digital Economy Lab, Adoption Monitor). In developer tooling, the adoption line is rising faster than trust, because 46% of Stack Overflow respondents say they distrust the accuracy of AI output (Stack Overflow, 2025 Developer Survey).
Takeaway: AI is no longer a future SaaS trend. It is now a packaging, pricing, and governance problem in the current stack.
Only 56% of Apps Are IT-Approved in BetterCloud’s 2026 Survey
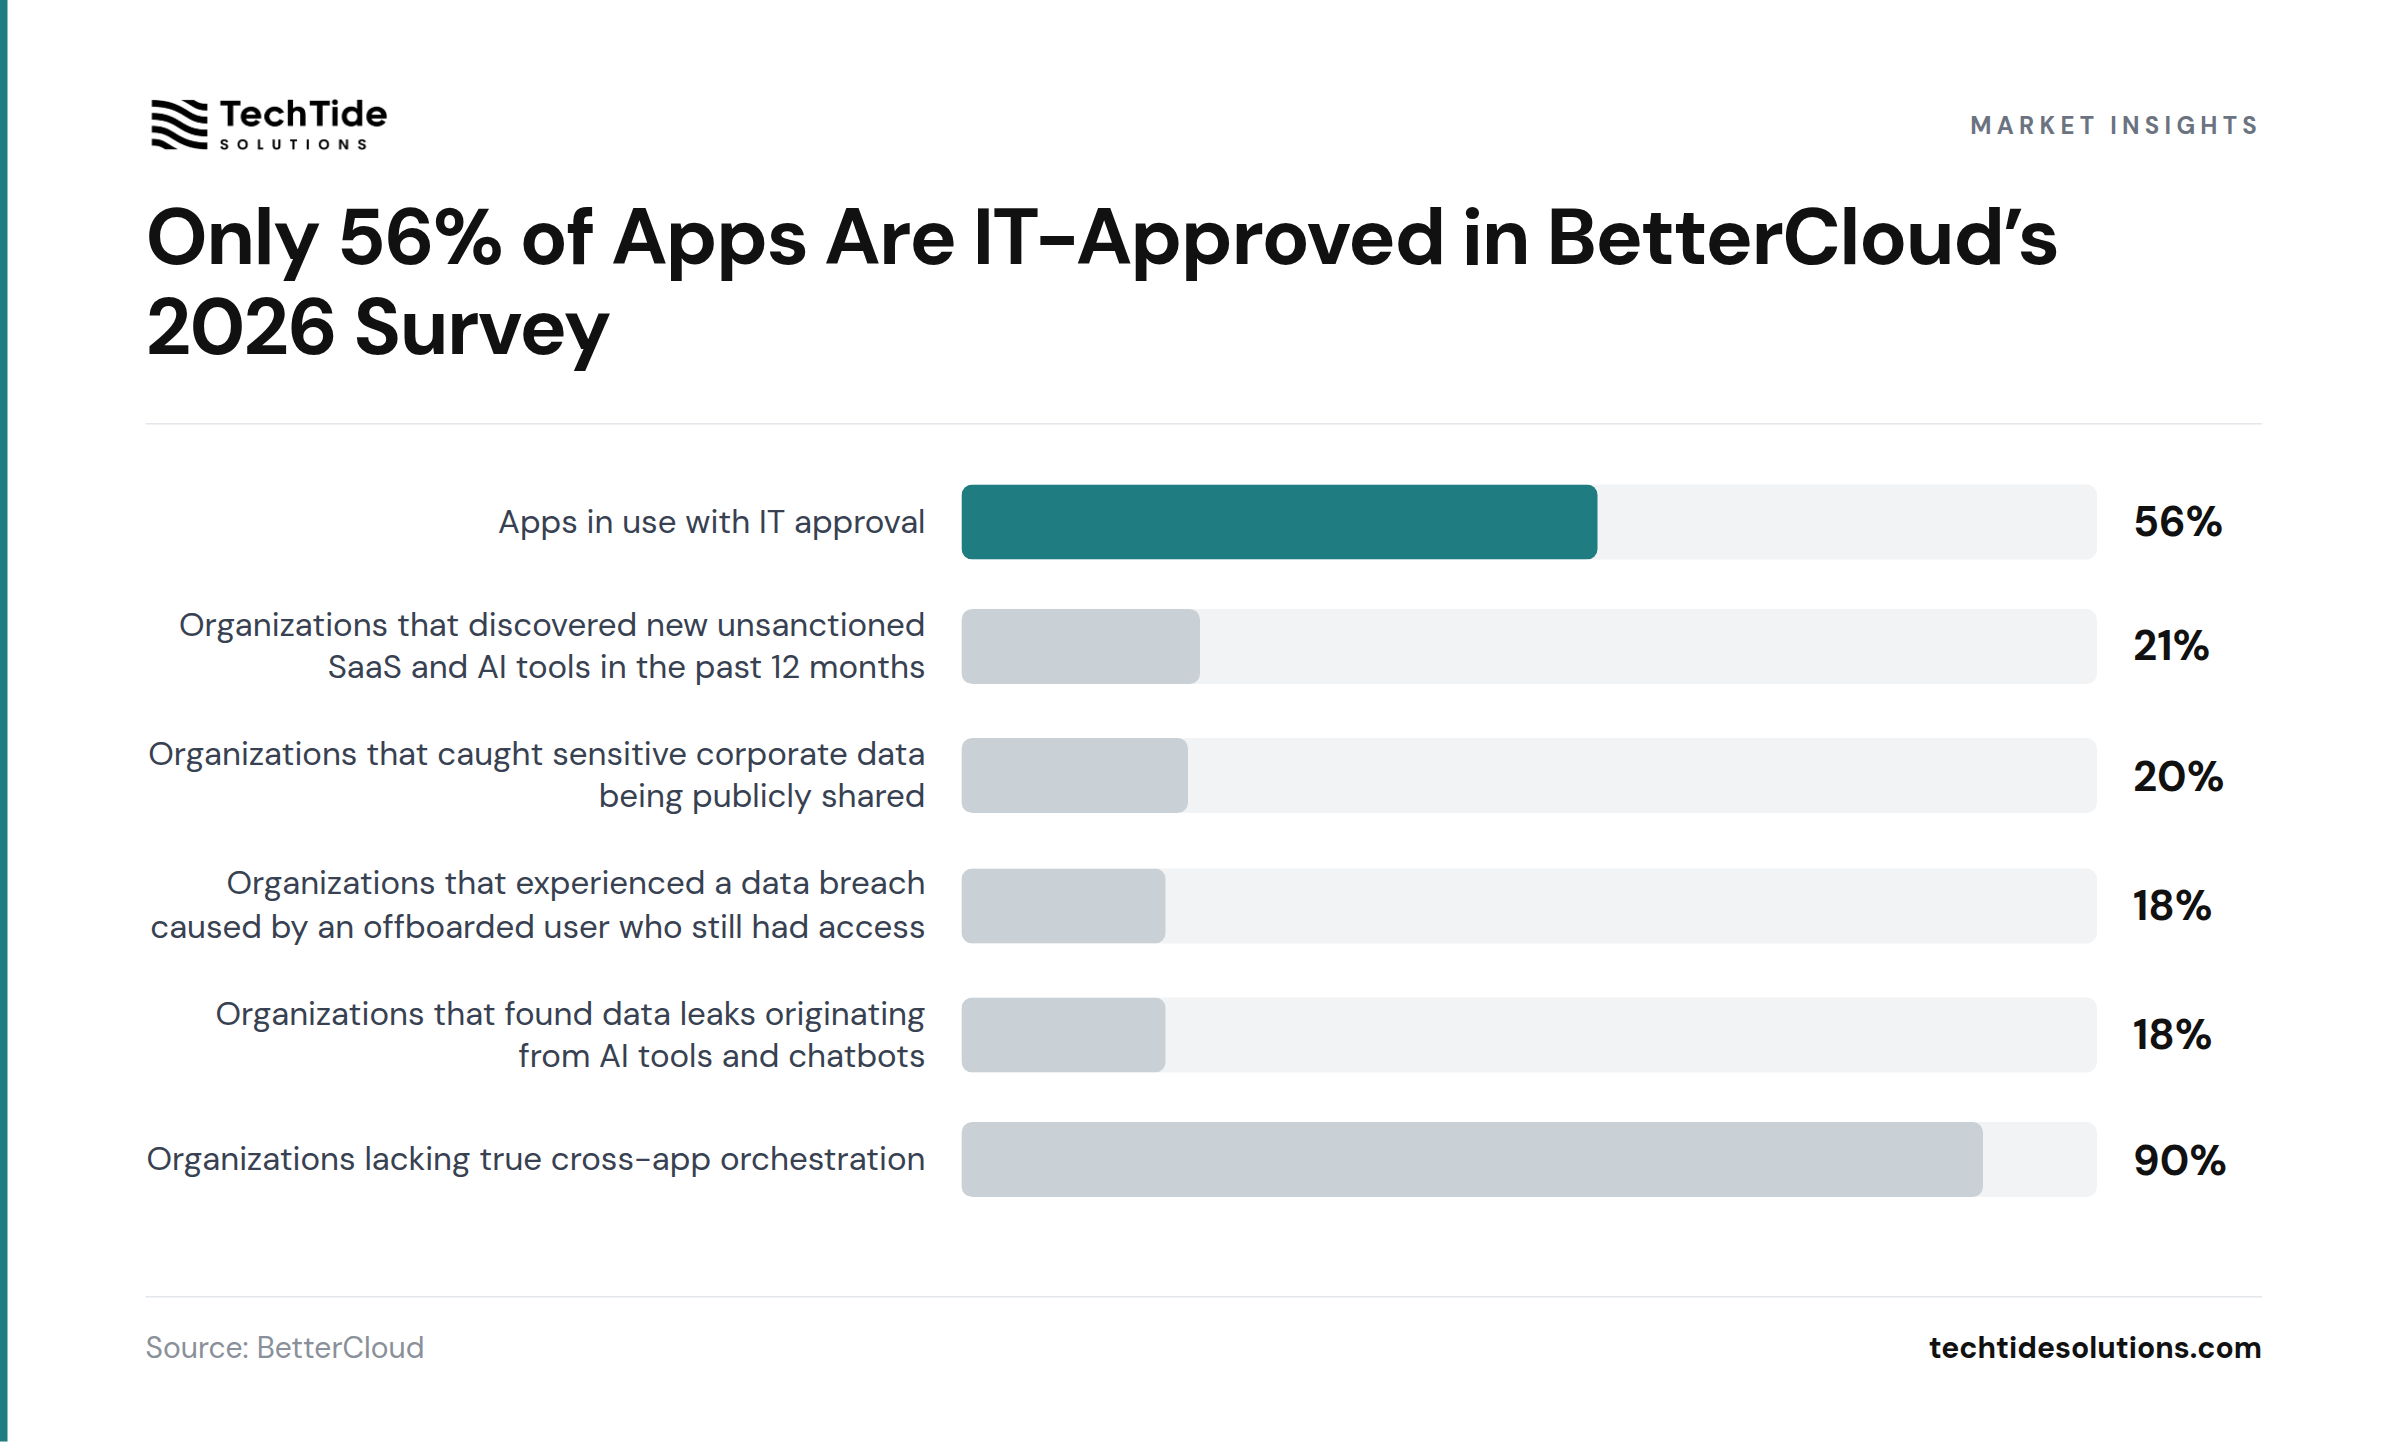
In BetterCloud’s 2026 survey of 525 IT and security professionals at SaaS-first organizations, only 56% of apps in use had IT approval (BetterCloud, The 2026 State of SaaS Report). The practical reading is simple. Even if total app counts stabilize, the unmanaged layer can still grow, especially once teams start buying AI-powered tools on expense cards or turning on AI features inside already-approved apps.
| Metric | Value | Source |
|---|---|---|
| Apps in use with IT approval | 56% | BetterCloud |
| Organizations that discovered new unsanctioned SaaS and AI tools in the past 12 months | 21% | BetterCloud |
| Organizations that caught sensitive corporate data being publicly shared | 20% | BetterCloud |
| Organizations that experienced a data breach caused by an offboarded user who still had access | 18% | BetterCloud |
| Organizations that found data leaks originating from AI tools and chatbots | 18% | BetterCloud |
| Organizations lacking true cross-app orchestration | 90% | BetterCloud |
Okta’s 2026 report points to the same management gap from a different angle. Among the executives it surveyed, 91% said their organizations were already using AI agents, but only 10% said they had a well-developed strategy to manage them, a finding from an identity vendor whose products benefit when governance complexity rises (Okta, Businesses at Work 2026).
Takeaway: In 2026, the real SaaS risk is less “too many logos” and more “too many unmanaged permissions, workflows, and AI connections.”
Private SaaS Benchmarks Point to Efficient Growth, Not Hypergrowth
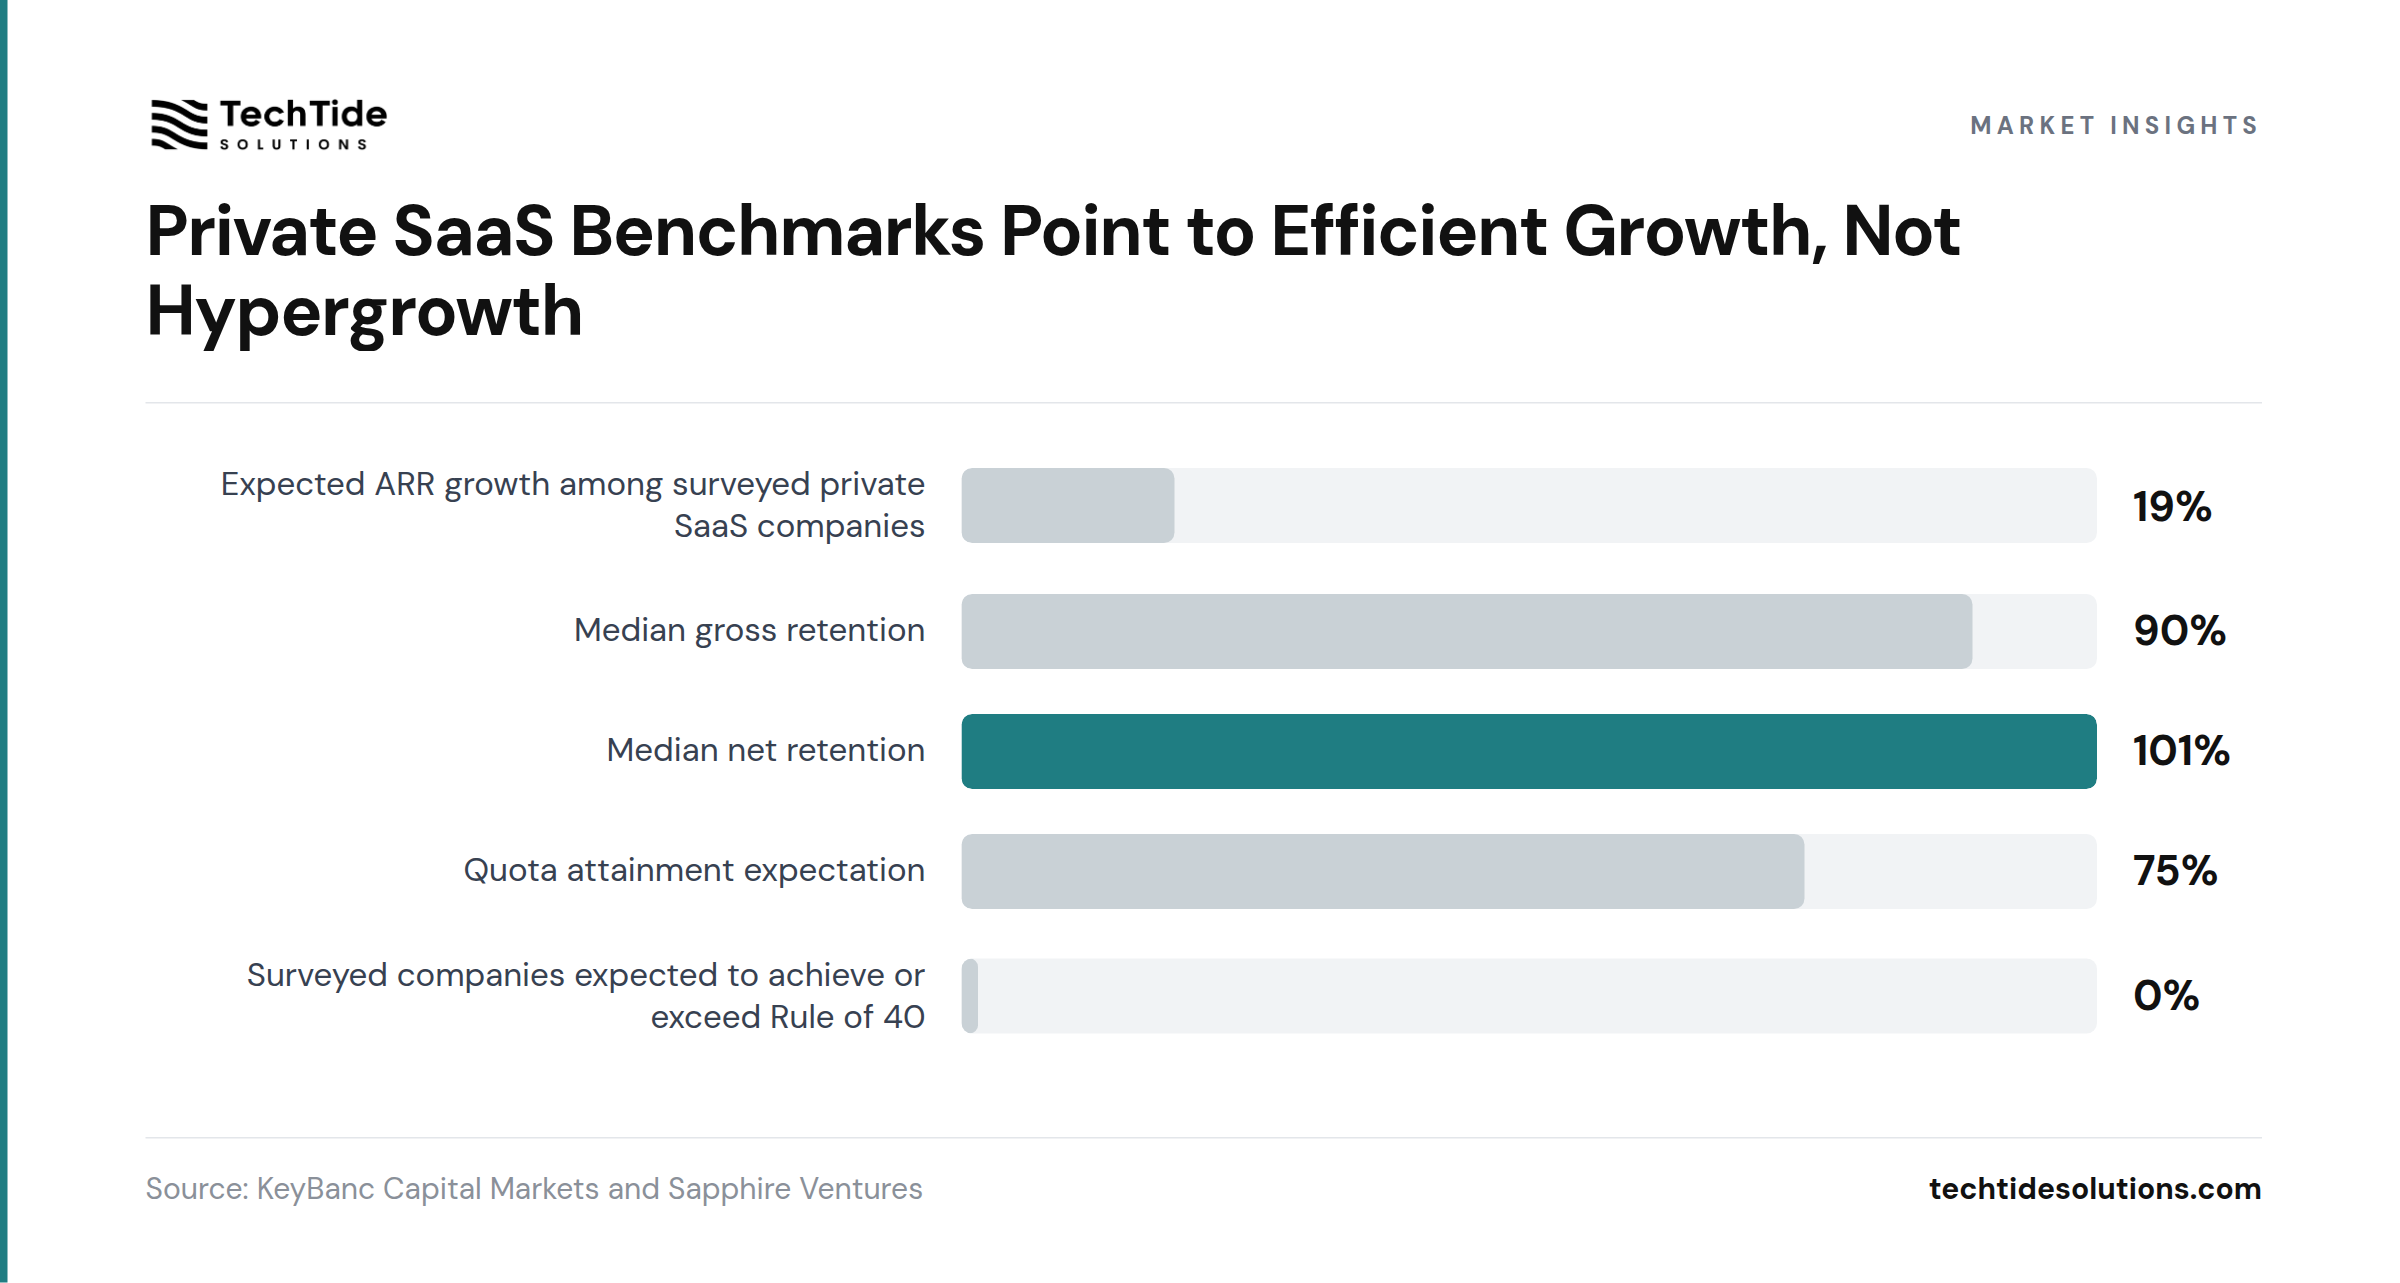
Among more than 100 private SaaS companies in KeyBanc’s 2024 survey, expected ARR growth for 2024 was about 19% (KeyBanc Capital Markets and Sapphire Ventures, Private SaaS Company Survey Reveals Shift Towards Future Growth With a Continued Focus on Operational Efficiency and Profitability 2024). That is healthy growth, but it is nowhere near old-school T2D3 mythology. The center of gravity has moved toward steadier retention, tougher quota setting, and sharper scrutiny on whether growth is profitable.
| Metric | Value | Source |
|---|---|---|
| Expected ARR growth among surveyed private SaaS companies | 19% | KeyBanc Capital Markets and Sapphire Ventures |
| Median gross retention | 90% | KeyBanc Capital Markets and Sapphire Ventures |
| Median net retention | 101% | KeyBanc Capital Markets and Sapphire Ventures |
| Quota attainment expectation | 75% | KeyBanc Capital Markets and Sapphire Ventures |
| Surveyed companies expected to achieve or exceed Rule of 40 | 0% | KeyBanc Capital Markets and Sapphire Ventures |
Private market valuation data reinforces the reset. In Bessemer’s 2025 Cloud 100 benchmarks, the average revenue multiple fell to 20x from 23x in 2024 and 26x in 2023, even as 95%+ of honorees were projected to surpass US$100 million ARR and the average company reached that milestone in 7.5 years. That means the market still pays for scale, but it pays less for narrative alone (Bessemer Venture Partners, The Cloud 100 Benchmarks Report 2025).
Takeaway: The 2026 SaaS benchmark is not “grow at any cost.” It is “keep growth respectable, keep retention above water, and prove the model compounds.”
What the Numbers Disagree About
Average App Counts Range From 101 to 342, a 239% Gap
Okta’s 2025 report put the average company at 101 apps, BetterCloud’s 2025 survey put the average organization at 106 apps, and Productiv says the average portfolio runs 342 apps per customer. Using Okta’s 101 as the lower anchor, Productiv’s 342 is about 239% higher. The gap is methodological, not mysterious. Okta measures deployed apps in its customer base, BetterCloud surveys SaaS-first IT teams, and Productiv emphasizes broad discovery across customer portfolios, which tends to count more of the long tail.
Most Headline Figures Are Fresh, but Historical Benchmarks Still Lean Older
In this article, most of the headline numbers come from 2026 releases, including Statista’s 2026 market model, Stanford’s 2026 AI research, Okta’s 2026 report, and BetterCloud’s 2026 survey. The figures that lean older are mostly the benchmark rows, especially KeyBanc’s 2024 private SaaS survey and Okta’s older app-count points used for the time series. That older material was unavoidable because SaaS operating benchmarks are published less often than market forecasts or AI adoption updates.
Surveys, Telemetry, and Forecast Models Measure Different Things
The evidence base here is a mix of forecast models, self-reported surveys, and platform telemetry. Confidence is highest when two types agree, such as AI adoption showing up in both McKinsey survey data and Stack Overflow developer behavior. Confidence is lower when a vendor has an incentive to spotlight the exact pain its product solves. The figure I would treat with the most caution is Productiv’s 342-app average, because it comes from a vendor’s own customer portfolio data and almost certainly reflects a broader definition of “in the stack” than simple deployment counts.
SaaS Statistics: Summary Table
| Metric | Value | Source |
|---|---|---|
| Global SaaS revenue, 2026 | US$488.53bn | Statista Market Insights |
| U.S. SaaS revenue, 2026 | US$254.94bn | Statista Market Insights |
| Average SaaS spend per employee, 2026 | US$132.38 | Statista Market Insights |
| Worldwide enterprise application SaaS revenue, 2024 | US$218.5bn | Gartner |
| Worldwide software spending, 2026 | US$1.44tn | Gartner |
| Average apps per company among Okta customers, 2026 | 98 apps | Okta |
| Average apps per company among Okta customers, 2025 | 101 apps | Okta |
| Average portfolio size per Productiv customer | 342 apps | Productiv |
| AI-powered apps as share of portfolio in BetterCloud’s 2026 survey | 22% | BetterCloud |
| Organizations regularly using AI in at least one business function | 88% | McKinsey |
| Developers using or planning to use AI tools | 84% | Stack Overflow |
| Apps with IT approval in BetterCloud’s 2026 survey | 56% | BetterCloud |
| Median net retention among surveyed private SaaS companies | 101% | KeyBanc Capital Markets and Sapphire Ventures |
| Surveyed private SaaS companies expected to achieve Rule of 40 | 0% | KeyBanc Capital Markets and Sapphire Ventures |
| Average Cloud 100 revenue multiple, 2025 | 20x | Bessemer Venture Partners |
FAQs
What is the 3 3 2 2 2 rule of SaaS?
The 3 3 2 2 2 rule usually refers to T2D3, short for triple, triple, double, double, double. Bessemer describes T2D3 as the growth pattern that defined the classic SaaS era, meaning a company triples revenue twice and then doubles it in each of the next three periods (Bessemer Venture Partners, The State of AI 2025).
It is best read as an aspirational venture benchmark, not a market average. In KeyBanc’s 2024 survey of more than 100 private SaaS companies, expected ARR growth was about 19%, which is far slower than any true T2D3 path (KeyBanc Capital Markets and Sapphire Ventures, Private SaaS Company Survey Reveals Shift Towards Future Growth With a Continued Focus on Operational Efficiency and Profitability 2024).
What are the 5 most important metrics for SaaS companies?
The five metrics most operators watch are ARR growth, gross retention, net retention, sales efficiency, and profitability. KeyBanc’s latest widely cited private SaaS benchmark is a good snapshot of why: median ARR growth was about 19%, gross retention about 90%, net retention about 101%, and quota attainment expectations rose to about 75% (KeyBanc Capital Markets and Sapphire Ventures, Private SaaS Company Survey Reveals Shift Towards Future Growth With a Continued Focus on Operational Efficiency and Profitability 2024).
The fifth metric is usually some version of profitability discipline, most often the Rule of 40. In the current market, you cannot separate growth from efficiency and still get a clean read on company quality (KeyBanc Capital Markets and Sapphire Ventures, Private SaaS Company Survey Reveals Shift Towards Future Growth With a Continued Focus on Operational Efficiency and Profitability 2024).
What is the Rule of 40 for SaaS?
The Rule of 40 says a SaaS company’s revenue growth rate plus profit margin should add up to at least 40%. KeyBanc’s 2024 survey calls it a best-in-class benchmark, but also shows how hard it is to hit now: none of the surveyed private SaaS companies were expected to achieve or exceed it in that year (KeyBanc Capital Markets and Sapphire Ventures, Private SaaS Company Survey Reveals Shift Towards Future Growth With a Continued Focus on Operational Efficiency and Profitability 2024).
That does not make the metric useless. It makes it stricter. Bessemer’s 2025 Cloud 100 data shows investors are still rewarding elite cloud businesses, but average revenue multiples still fell to 20x from 23x in 2024 and 26x in 2023, which tells you efficiency alone is not enough and growth alone is not enough either (Bessemer Venture Partners, The Cloud 100 Benchmarks Report 2025).
Why is SaaS declining?
The short answer is that SaaS is not declining as a market. Global SaaS revenue is projected to reach US$488.53 billion in 2026, up from US$251 billion in 2024 in Statista’s model (Statista, Software as a Service – Worldwide 2026).
What is declining in some datasets is sprawl tolerance and valuation generosity. Among Okta customers, average deployed apps fell from 101 in the 2025 report to 98 in the 2026 report, while Bessemer’s Cloud 100 average revenue multiple fell to 20x from 23x in 2024 and 26x in 2023 (Okta, Businesses at Work 2025; Okta, Businesses at Work 2026; Bessemer Venture Partners, The Cloud 100 Benchmarks Report 2025). So the category is still growing, but buyers and investors are asking harder questions.
What Changed: 2025 vs 2026
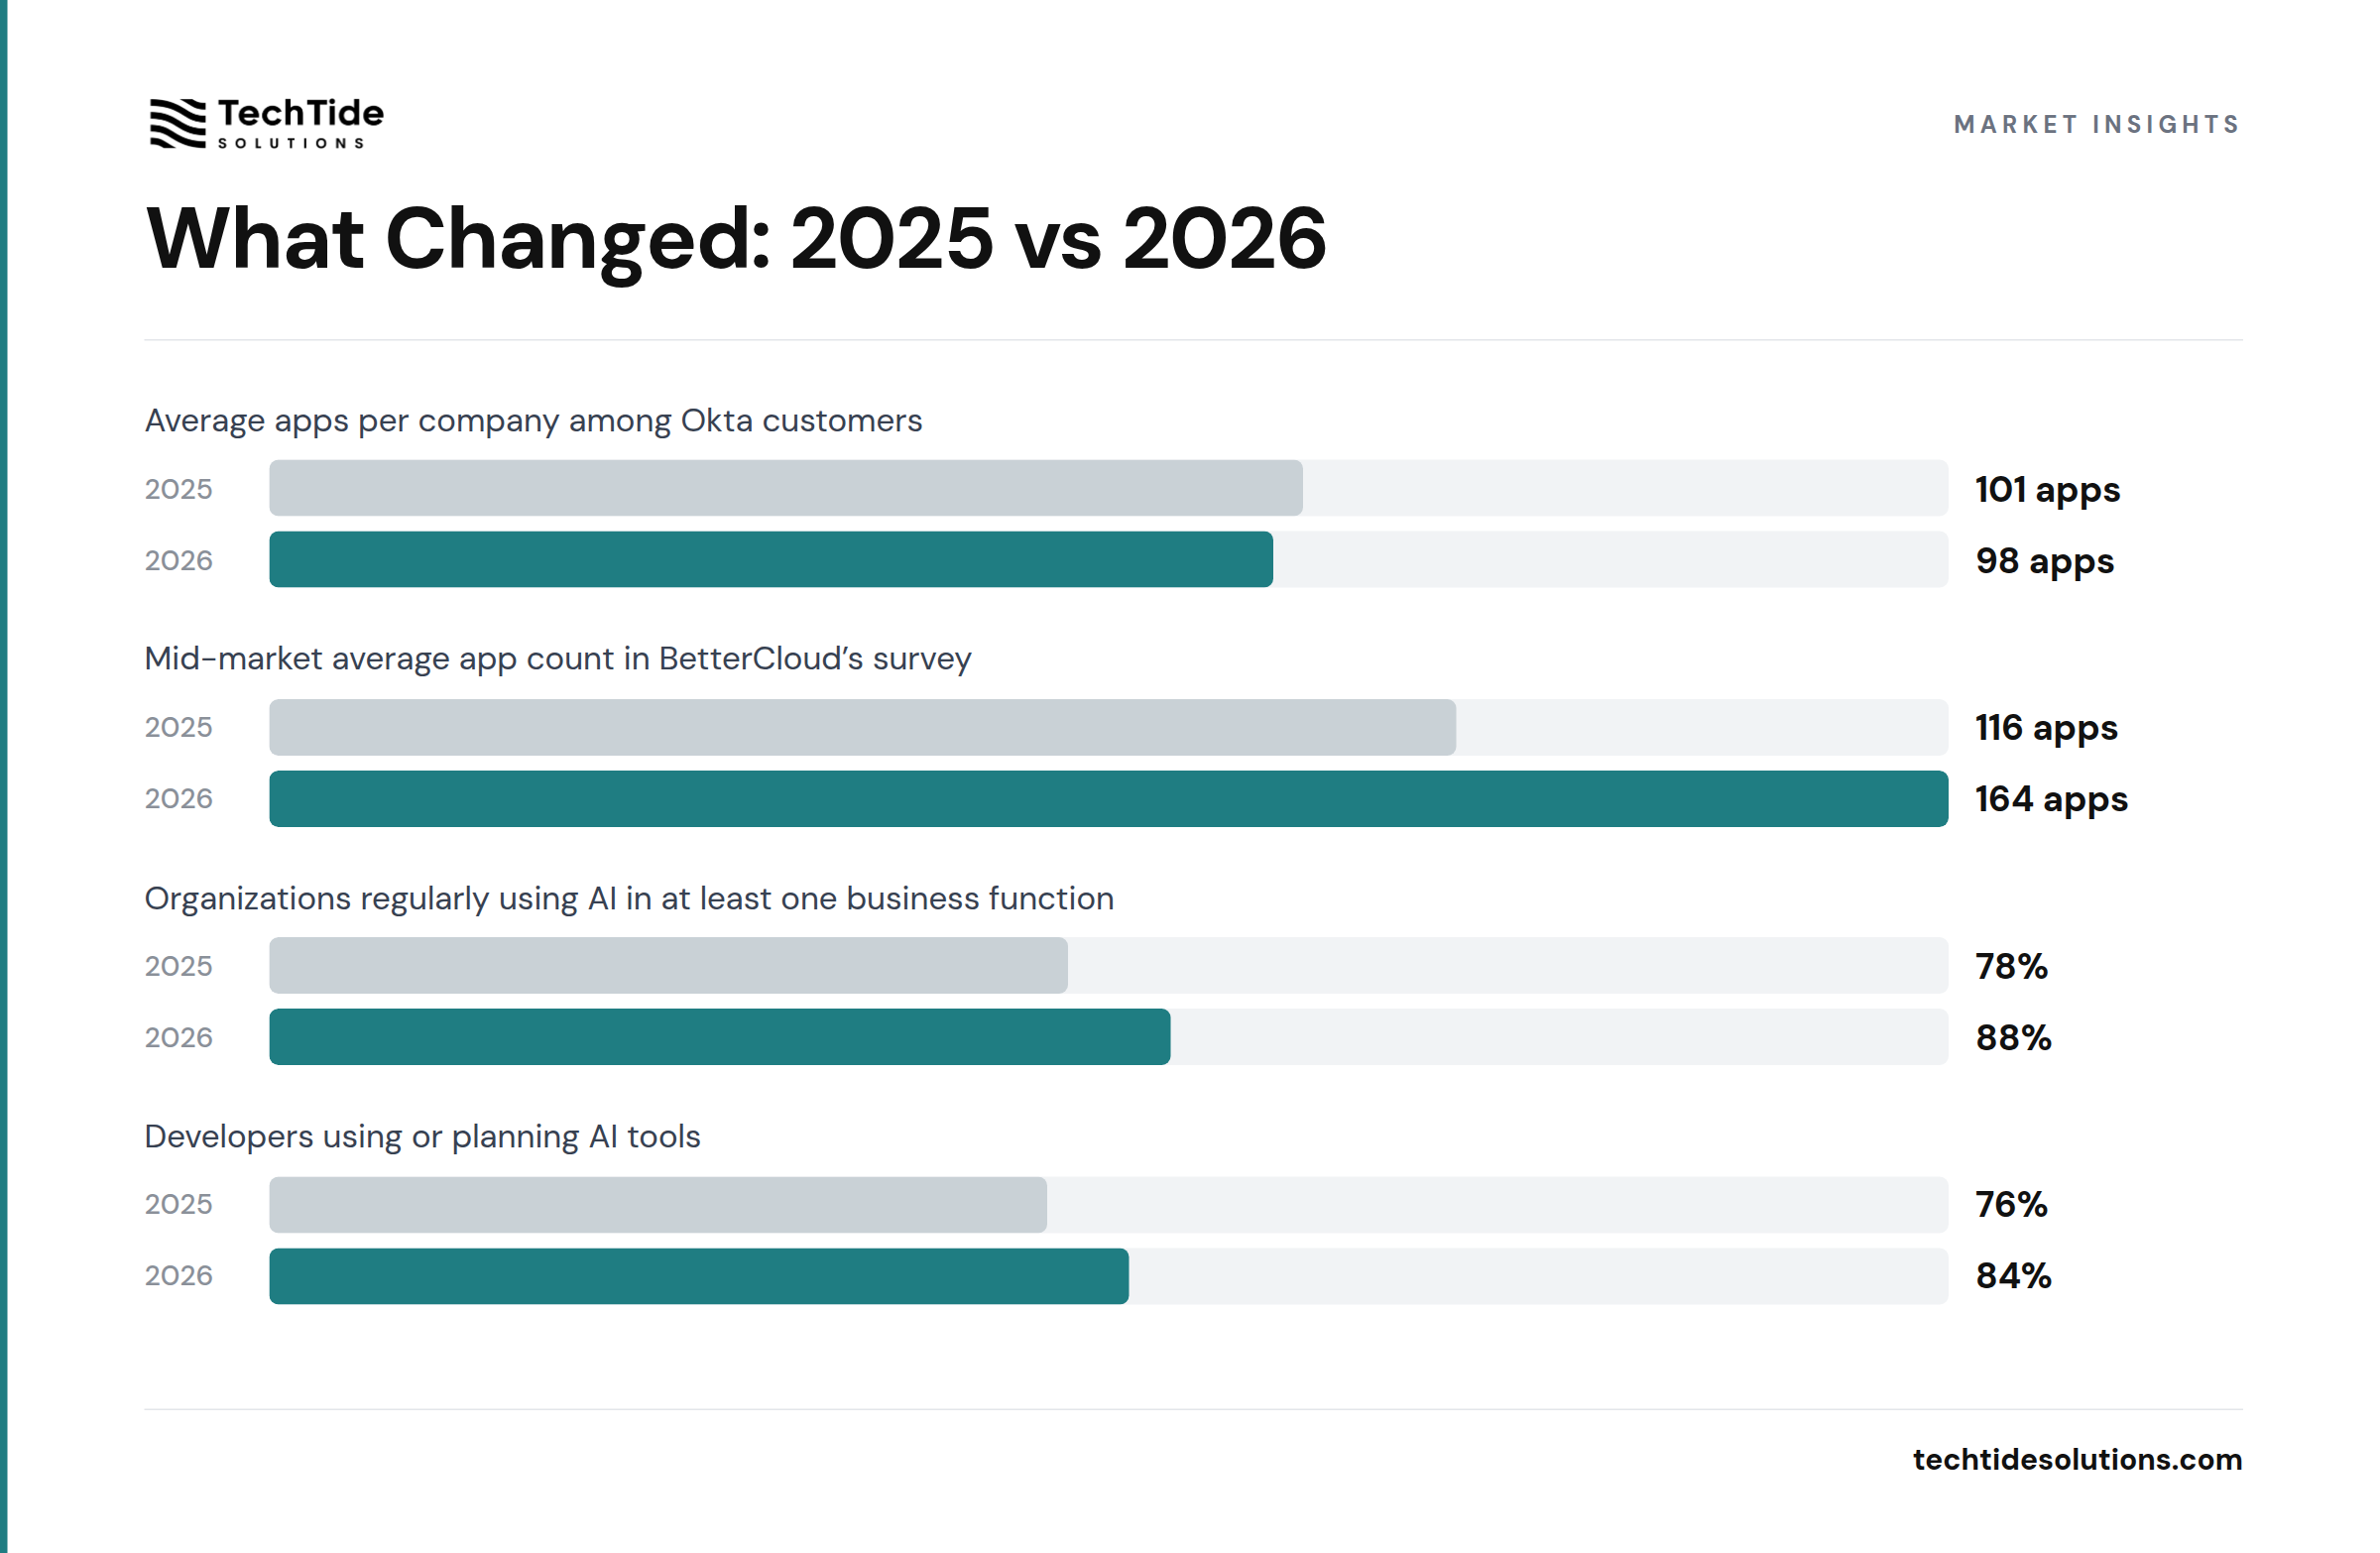
The biggest shift from the 2025 edition of the evidence base to the 2026 edition is that AI moved from feature layer to stack driver. That change is clearest in portfolio data, where mid-market app counts in BetterCloud’s sample jumped from 116 to 164, and in adoption data, where McKinsey’s AI-use figure rose from 78% to 88%. The result is a SaaS market that is still adding value, but with more governance drag and less room for waste.
| Metric | 2025 | 2026 | Change |
|---|---|---|---|
| Average apps per company among Okta customers (Okta, Businesses at Work 2025; Okta, Businesses at Work 2026) | 101 apps | 98 apps | ↓ 3.0% |
| Mid-market average app count in BetterCloud’s survey (BetterCloud, State of SaaS 2025; BetterCloud, The 2026 State of SaaS Report) | 116 apps | 164 apps | ↑ 41.4% |
| Organizations regularly using AI in at least one business function (McKinsey, The State of AI in 2025: Agents, Innovation, and Transformation) | 78% | 88% | ↑ 12.8% |
| Developers using or planning AI tools (Stack Overflow, 2025 Developer Survey) | 76% | 84% | ↑ 10.5% |
Reversing: Mid-Market App Growth Jumped 41%
In BetterCloud’s benchmark, mid-market organizations went from 116 apps in the earlier comparison point to 164 in the 2026 report (BetterCloud, State of SaaS 2025; BetterCloud, The 2026 State of SaaS Report). The likely driver is AI tool adoption, because BetterCloud says organizations now deploy 27 AI-powered SaaS apps on average and those represent 22% of the stack (BetterCloud, The 2026 State of SaaS Report). If that continues, 2027 will be less about consolidation and more about policy enforcement.
Decelerating: Okta’s Average App Count Slipped From 101 to 98
Among Okta customers, the average deployed app count moved from 101 in the 2025 edition to 98 in the 2026 edition (Okta, Businesses at Work 2025; Okta, Businesses at Work 2026). The likely driver is that larger enterprises are pruning duplicate tools even while AI experimentation continues elsewhere in the stack. If that tension holds, 2027 will likely show flatter top-level counts but more hidden complexity.
Accelerating: Business AI Use Rose From 78% to 88%
McKinsey’s global survey moved from 78% of organizations regularly using AI in at least one function to 88% in the latest wave (McKinsey, The State of AI in 2025: Agents, Innovation, and Transformation). The likely driver is that AI has shifted from isolated pilots into line-of-business workflows. If that trend keeps running, SaaS vendors without a credible AI layer will face harder renewal conversations.
Accelerating: Developer AI Tool Use Rose From 76% to 84%
Stack Overflow reports that developers using or planning to use AI tools rose from 76% to 84% year over year, even as distrust in output accuracy remained high at 46% (Stack Overflow, 2025 Developer Survey). The likely driver is practical utility in day-to-day workflows, especially coding assistance and documentation tasks. Into 2027, the winners will likely be the SaaS tools that combine AI speed with verifiable output.
The shift to watch most closely into 2027 is the gap between AI adoption and AI governance, because that is where new SaaS spend, new security risk, and new buyer scrutiny now meet.
Methodology and Sources
This article prioritizes primary and near-primary sources with disclosed methodology, including official market forecasts, original surveys, platform telemetry, and research-firm publications. Independent sources were used first for headline market size, AI adoption, and valuation context. Vendor research was included only where it added operational texture, and each vendor figure is labeled to show scope, such as “among Okta’s customer base” or “in BetterCloud’s survey of 525 IT and security professionals.”
Market-size figures were checked against a second source where possible, and older figures were kept only when they were the most recent accessible benchmark for a specific metric. For this report we ran 89 targeted searches across 85 domains and kept 12 sources that publish accessible, traceable data. Where two numbers disagreed, the article names the likely reason, usually scope, sampling frame, or model boundary. No statistic was included if it could not be traced to a real report or official page.
- Statista, Software as a Service – Worldwide 2026, https://www.statista.com/outlook/tmo/cloud-computing/software-as-a-service/worldwide?currency=USD
- Gartner, Gartner Forecasts Worldwide IT Spending to Grow 13.5% in 2026, Totaling $6.31 Trillion, https://www.gartner.com/en/newsroom/press-releases/2026-04-22-gartner-forecasts-worldwide-it-spending-to-grow-13-point-5-percent-in-2026-totaling-6-point-31-trillion-dollars
- Gartner, Market Share: Enterprise Application Software as a Service, Worldwide, 2024, https://www.gartner.com/en/documents/6526202
- Okta, Businesses at Work 2026, https://www.okta.com/newsroom/articles/businesses-at-work-2026/
- Okta, Businesses at Work 2025, https://www.okta.com/newsroom/articles/businesses-at-work-2025/
- Okta, Businesses at Work 2024, https://www.okta.com/resources/research/businesses-at-work-2024/
- Okta, Businesses at Work 2022, https://www.okta.com/sites/default/files/2022-01/Businesses-at-Work-2022-Annual-Report.pdf
- BetterCloud, The 2026 State of SaaS Report, https://www.bettercloud.com/monitor/the-2026-state-of-saas-report/
- BetterCloud, State of SaaS 2025, https://pages.bettercloud.com/rs/719-KZY-706/images/BetterCloud-State-of-SaaS-2025.pdf
- Productiv, Why Duplicative SaaS Apps Are Dominating Your Tech Stack 2025, https://productiv.com/blog/duplicative-saas-apps/
- McKinsey, The State of AI in 2025: Agents, Innovation, and Transformation, https://www.mckinsey.com/capabilities/quantumblack/our-insights/the-state-of-ai
- Stanford HAI, The 2026 AI Index Report, https://hai.stanford.edu/ai-index/2026-ai-index-report
- Stanford Digital Economy Lab, Adoption Monitor, https://digitaleconomy.stanford.edu/project/indicators/adoptionmonitor/
- Stack Overflow, 2025 Developer Survey, https://survey.stackoverflow.co/2025/ai
- KeyBanc Capital Markets and Sapphire Ventures, Private SaaS Company Survey Reveals Shift Towards Future Growth With a Continued Focus on Operational Efficiency and Profitability 2024, https://investor.key.com/press-releases/news-details/2024/PRIVATE-SAAS-COMPANY-SURVEY-REVEALS-SHIFT-TOWARDS-FUTURE-GROWTH-WITH-A-CONTINUED-FOCUS-ON-OPERATIONAL-EFFICIENCY-AND-PROFITABILITY/default.aspx
- Bessemer Venture Partners, The Cloud 100 Benchmarks Report 2025, https://www.bvp.com/atlas/the-cloud-100-benchmarks-report/
- Bessemer Venture Partners, The State of AI 2025, https://www.bvp.com/atlas/the-state-of-ai-2025
Last updated: July 2026
We refresh this page as new data becomes available.

