Big data analytics is the discipline we reach for when “normal” reporting stops being enough—when leaders need to understand not only what happened, but what is happening right now, what might happen next, and what levers to pull before a quarter goes sideways. From our vantage point at TechTide Solutions, a fact that’s easy to miss is that analytics is rarely a tooling problem first; it is a decision-making problem first, and tooling merely amplifies the clarity (or the chaos) already present in the business.
What is big data analytics and why it matters for decision-making
1. Big data analytics definition: providing insights from large, complex data sets
In plain terms, big data analytics is the practice of providing usable insights from data that is too large, too fast, or too messy for traditional approaches to handle comfortably. In that sense, “big” is less about a single threshold and more about a mismatch: the organization’s questions outgrow the organization’s data handling habits.
Market signals also underline why this field keeps expanding: Gartner’s market share research reports the data and analytics software market grew by 13.9% to $175.17 billion in 2024—a reminder that enterprises are investing heavily in platforms that can turn data into decisions rather than data into dashboards.
2. Common big data sources: IoT sensors, social media, transactions, web, mobile, and smart devices
Most big data programs start with familiar sources—transaction logs, customer interactions, and operational events—then quickly expand into high-volume, high-granularity feeds like connected device telemetry, clickstream events, and third-party enrichment. In our projects, the “aha” moment often arrives when a client realizes that their most valuable signals are not the ones they intentionally collected, but the ones they accidentally produced as exhaust: application logs, support conversations, shipment scans, or product usage events.
Because those feeds arrive in different shapes and tempos, we treat source mapping as architecture, not administration. A point-of-sale receipt, a web event, and an equipment sensor reading can all describe the same customer moment, yet they typically live in different systems with different identifiers and different failure modes.
3. What big data analytics can deliver: trends, patterns, correlations, predictions, and what-if analysis
When big data analytics is done well, it creates a kind of organizational “second sight”: trend detection that is fast enough to matter, pattern recognition that is specific enough to act on, and forecasting that improves planning rather than merely decorating slide decks. Correlations are useful, but we push teams to go further—toward causal hypotheses, controlled interventions, and feedback loops that reveal whether an action worked.
What-if analysis is where decision-making becomes tangible. Instead of asking “What are sales by region?”, we can ask, “If we reduce delivery times in specific zones, how does that change conversion and returns?” Once a business starts thinking in those terms, analytics stops being a reporting function and becomes an operating system for strategy.
Recommended reading: What Is Data Structure? Meaning, Types, and Why It Matters in Programming
What makes data “big”: the five V’s and data formats
The “V” framework is popular because it’s practical: it breaks a fuzzy concept into engineering constraints. In our experience, the trick is not memorizing the terms; it is diagnosing which V is breaking your pipeline today—and which V will break it tomorrow after the next product launch or acquisition.
1. Volume: handling massive amounts of data cost-effectively
Volume becomes “big” when storage and compute stop scaling linearly with business value. At that point, cost engineering matters as much as query engineering: partition strategies, lifecycle policies, compression formats, and workload isolation determine whether a platform stays sustainable.
Architecturally, we separate “data we must keep” from “data we can recreate,” then design retention and aggregation policies around that distinction. Done thoughtfully, this reduces spend while improving performance, because fewer workloads compete for the same hot paths.
2. Velocity: processing fast-moving data streams and near real-time data
Velocity is the V that forces uncomfortable choices. Fast-moving data streams introduce constraints around ingestion backpressure, ordering guarantees, late arrivals, and idempotency. Even when the business only asks for “near real-time,” the technical requirement is usually “predictable latency under failure.”
From our build perspective, velocity also changes the way teams think about correctness. In batch, you can rerun a job and pretend the past is stable; in streaming, the present is always arriving slightly out of order, and your system must reconcile reality continuously.
3. Variety: combining structured, semi-structured, and unstructured data
Variety is where most analytics ambitions go to die—unless teams plan for it. Mixing operational tables with event payloads, documents, images, or text requires more than connectors; it requires a canonical modeling strategy so that disparate signals can agree on what “customer,” “session,” “device,” or “claim” actually means.
In practice, variety also means multiple managed regimes. A support message may be sensitive in a way that a shipment timestamp is not, and a single analytic dataset can inherit the strictest constraints of any input if managed is not designed deliberately.
4. Veracity and variability: managing data trustworthiness and changing conditions
Veracity is about whether data can be trusted; variability is about how quickly the meaning of data changes. Those challenges show up in mundane places: a mobile app update changes event names, an upstream vendor modifies a field, or a regional rollout adds new categories. Suddenly, your “trend” was a schema change.
At TechTide Solutions, we treat data contracts and validation as product features, not red tape. When producers and consumers agree on event semantics—and when pipeline checks enforce those semantics—analytics becomes stable enough to support automation rather than only retrospectives.
5. Value: turning raw data into actionable intelligence
Value is the only V that matters to the business, and it is the V that engineering teams often postpone. A blunt reminder comes from industry research on unused data: one Seagate report on enterprise data suggests 68% of data available to businesses goes unleveraged, which matches what we see when organizations collect data faster than they can interpret it.
To turn data into value, we insist on tying datasets to decisions. If no one can name the decision a dataset supports, that dataset is likely to become storage cost dressed up as “strategy.”
6. Structured vs semi-structured vs unstructured data: why format impacts analytics
Format shapes everything: storage layout, indexing strategy, query performance, and the kinds of analysis that are feasible without heroic preprocessing. Structured data (tables with stable columns) powers classic BI and operational reporting, while semi-structured data (like event payloads) makes product analytics and experimentation possible at scale.
Unstructured data—text, audio, images, and documents—often contains the richest signals, but it requires feature extraction and more careful managed. When teams treat unstructured data as “later,” they tend to delay the very insights that can differentiate customer experience and risk detection.
Recommended reading: Stacks and Queues Data Structures: Concepts, Operations, Implementations, and Use Cases
Differences between big data analytics and traditional data analytics
Traditional analytics is not obsolete; it is simply optimized for a different world. The gap appears when business questions demand broader context, finer granularity, and faster feedback than legacy pipelines can support.
1. Data types and storage: relational databases vs mixed-format, high-scale repositories
Traditional analytics often assumes relational storage: normalized schemas, predictable query patterns, and carefully curated datasets. Big data analytics embraces mixed-format repositories—object storage, distributed files, document stores, and columnar datasets—because modern signals are rarely born relational.
That shift changes design priorities. Instead of optimizing only for consistent transactions, platforms must optimize for read-heavy analytics, large scans, schema evolution, and concurrent workloads from data science, BI, and operational monitoring.
2. Techniques and tooling: SQL and traditional statistics vs machine learning, data mining, and distributed systems
SQL remains foundational, and we still lean on it for clarity and auditability. Big data analytics adds distributed systems, feature engineering, data mining, and machine learning workflows that can learn from patterns humans do not easily spot.
Operationally, the difference is that machine learning does not just answer questions—it creates new questions. A churn model, for example, forces a business to define what churn is, which interventions are allowable, and how success will be measured over time.
3. Why older tools fall short: scale, speed, and complexity limits
Older tools fall short not because they are “bad,” but because their assumptions become brittle: data fits on one machine, batch windows are acceptable, and schemas change slowly. Once event data, device telemetry, and multi-channel customer journeys enter the picture, those assumptions collapse.
From a systems viewpoint, big data requires fault tolerance as a first-class property. When components fail—and they will—pipelines must recover without duplicating results, corrupting aggregates, or silently dropping events that later become “mysterious” business anomalies.
Recommended reading: Data Driven Decision Making: Benefits, Process, and Tools to Implement It
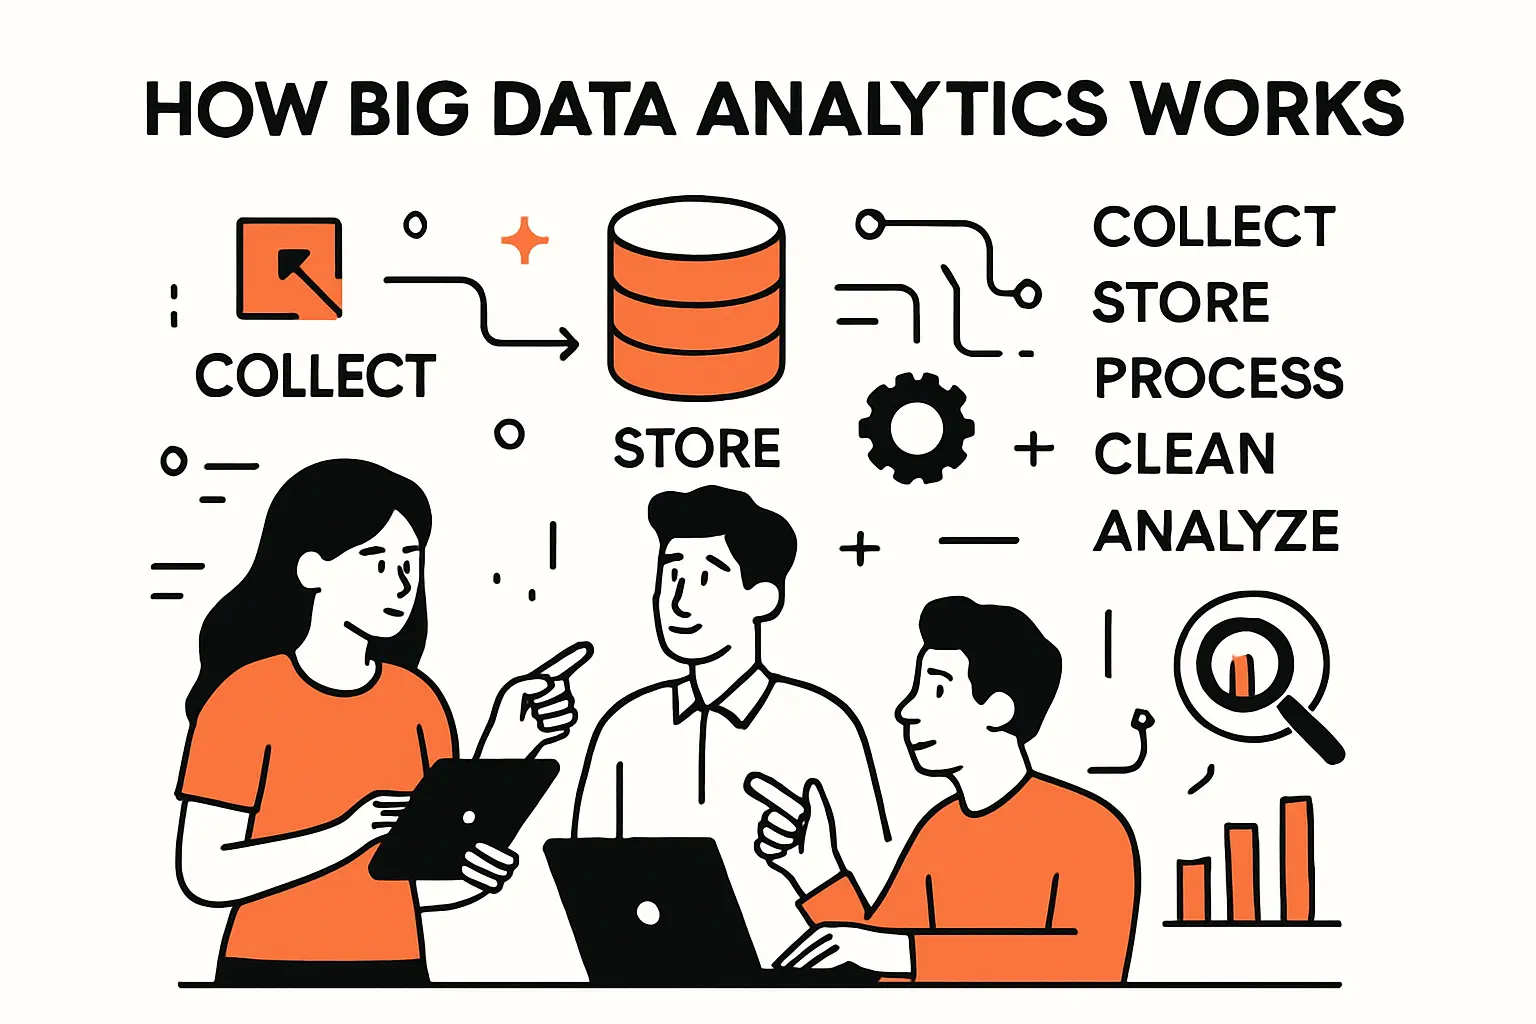
How big data analytics works: collect, store, process, clean, analyze
Big data analytics is often depicted as a neat pipeline, but real systems are messy: sources evolve, definitions drift, and stakeholders ask new questions midstream. We build platforms that can absorb that mess without losing trust, because trust is the currency of analytics adoption.
1. Collect: gathering data across web, mobile, cloud, and connected devices
Collection begins with instrumentation: deciding which events to capture, how to name them, and how to attach identity. In product analytics, this often means defining a consistent event taxonomy so that “viewed,” “clicked,” “added,” and “purchased” mean the same thing across platforms.
On the integration side, we prefer approaches that minimize tight coupling. When sources publish events or extracts in a standardized way, downstream consumers can evolve independently, which keeps analytics from becoming hostage to a single application team’s sprint schedule.
2. Store: using data lakes, data warehouses, and lakehouse-style approaches
Storage is where strategy becomes concrete. Data lakes offer flexible, low-cost storage for raw and semi-curated data, while data warehouses provide performance, governance, and a strong semantic layer for analytics. Lakehouse-style patterns attempt to blend those strengths by supporting warehouse-like performance on lake-like storage.
In our builds, the decision is rarely ideological. Instead, we ask: which workloads need strict governance and predictable performance, and which ones need exploration and schema flexibility? The answer usually leads to a layered architecture rather than a single repository.
3. Process: verifying, sorting, filtering, and preparing data for queries
Processing is the discipline of turning raw signals into analytical assets. Verification checks whether inputs match expectations; sorting and filtering create consistent ordering and reduce noise; preparation aligns time zones, identifiers, and business definitions so that queries tell the truth rather than merely returning rows.
From an engineering standpoint, processing is also about making data queryable at reasonable cost. If every analyst query triggers a full scan of raw events, the platform will become slow, expensive, and politically unpopular in short order.
4. Batch processing vs stream processing: tradeoffs in speed, complexity, and cost
Batch processing is simpler to reason about and often cheaper to operate, especially when the business can tolerate delay. Stream processing enables rapid reaction—fraud detection, operational alerts, real-time personalization—but it introduces complexity around state, replays, and event-time correctness.
When clients ask us which approach is “better,” we answer with a question of our own: which decisions lose value if delayed? That framing usually clarifies where streaming is essential and where batch is perfectly adequate.
5. Clean and scrub: removing duplicates, fixing errors, and standardizing formats
Cleaning is the unglamorous work that makes analytics credible. Duplicates sneak in through retries; errors appear from partial deployments; formats vary across regions, devices, or partner systems. Without standardized handling, downstream models and dashboards inherit inconsistency and turn it into false confidence.
As a rule, we automate cleaning where possible and document exceptions where not. Data quality is not a one-time project; it is an operational posture that must survive staff turnover, new vendors, and shifting product strategies.
6. Analyze: applying data mining, statistical analysis, machine learning, deep learning, and natural language processing
Analysis is where technique meets intent. Data mining and statistics help uncover relationships and quantify uncertainty, while machine learning can generalize patterns to unseen cases—detecting anomalies, predicting behavior, or segmenting customers by latent traits.
Natural language processing is increasingly important because customer experience is narrated in text: reviews, chat transcripts, call summaries, and support tickets. When those signals are integrated with structured operational data, teams can connect “why customers are upset” to “what changed in the product,” which is where analytics becomes actionable.
Recommended reading: Tree Data Structure: Types, Terminology, Operations, and Applications
Types of big data analytics: descriptive to prescriptive and beyond
Analytics maturity is often described as a progression, but organizations don’t climb a single ladder. In our experience, they run multiple tracks at once: descriptive for finance, predictive for operations, and real-time for customer-facing experiences.
1. Descriptive analytics: understanding what happened
Descriptive analytics summarizes history: what was sold, what failed, what was delayed, what was clicked. Despite its simplicity, it is foundational because it creates a shared narrative across teams. If leaders cannot agree on basic metrics, advanced analytics becomes a debate club rather than a decision engine.
From a delivery standpoint, we prioritize definitions and lineage. A metric that is fast but ambiguous will cause more organizational friction than a metric that is slightly slower but trusted.
2. Diagnostic analytics: understanding why it happened
Diagnostic analytics digs into causes: which cohort drove churn, which marketing channel produced low-quality leads, which supplier delay cascaded into fulfillment failures. Here, big data matters because explanations often live at the intersection of many datasets—product usage, support interactions, operations, and finance.
In practice, diagnostic work benefits from drill-down paths that mirror how humans think. When a dashboard supports exploration—without forcing users to write complex queries—teams move from blaming symptoms to fixing root causes.
3. Predictive analytics: forecasting what will happen
Predictive analytics helps estimate future outcomes, such as demand, risk, inventory needs, or the chance that a customer may leave. In technical terms, this usually means one stage for training the model with past data and another stage for using the model in live systems that need to give results quickly under real business limits.
We treat prediction as part of a real product, not just a test version. That means watching for changes in model quality, handling cases where needed input data may change or be missing, and building backup logic so the business can keep running even when a model is updated or briefly not available.
4. Prescriptive analytics: recommending what to do next
Prescriptive analytics recommends actions, often by optimizing tradeoffs under constraints. Instead of predicting that demand will rise, prescriptive systems suggest staffing adjustments, reorder timing, or routing changes to meet service levels at lower cost.
Organizationally, prescriptions demand governance. A recommendation engine that cannot explain constraints, objectives, and safety checks will be ignored by operators—or worse, it will be followed blindly until it causes a preventable incident.
5. Real-time analytics: acting on events as they occur
Real-time analytics is about acting while the moment is still alive: catching fraud during authorization, triggering support interventions while a customer is struggling, or rerouting logistics before delays compound. The technical challenge is not only speed; it is consistent decisioning while events arrive imperfectly.
From our standpoint, the most successful real-time systems define “good enough now” versus “perfect later.” They act quickly with bounded risk, then reconcile with more complete batch computations to refine truth over time.
6. Spatial analytics: optimizing decisions using location-based data
Spatial analytics uses location as a first-class feature: delivery routing, site selection, service coverage, asset tracking, and localized demand forecasting. Businesses like rideshare platforms, logistics carriers, and retailers with dense footprints thrive on spatial signals because location links the digital world to operational reality.
In implementation, spatial work benefits from careful indexing and privacy controls. Location is sensitive, and it is also noisy; treating it as “just another field” leads to both compliance risk and poor analytic quality.
7. Text analytics: providing insights from unstructured text like reviews and messages
Text analytics converts narrative into signal: sentiment, topics, urgency, and recurring pain points. In customer support, it can reveal which product changes triggered confusion; in insurance, it can help triage claims; in HR, it can surface themes in engagement feedback—when governed responsibly.
We often combine text analytics with structured outcomes. When a spike in negative sentiment aligns with a deployment or a vendor outage, teams stop guessing and start validating hypotheses with evidence.
Big data analytics technologies and tools
The tool landscape is crowded, and marketing often obscures the real differentiator: operational fit. We care less about brand names and more about whether the tooling supports reliable ingestion, scalable compute, and governance that teams can actually maintain.
1. Collection and storage: Hadoop ecosystems, NoSQL databases, and distributed storage
Collection and storage tooling exists to absorb variety and volume without collapsing under operational complexity. Hadoop popularized the idea of distributed storage and compute as commodity infrastructure, while NoSQL databases emerged to support flexible schemas and horizontally scalable access patterns.
In modern architectures, distributed object storage and table formats can serve as a durable backbone for both exploration and production analytics. The key is to separate concerns: raw ingestion, curated datasets, and consumption layers should not fight over the same storage contracts.
2. Processing at scale: MapReduce, cluster resource management, and in-memory processing with Spark
Processing frameworks exist to make scale routine rather than heroic. MapReduce established a batch paradigm for large distributed jobs, while cluster resource managers coordinate multi-tenant workloads across shared compute. In-memory processing engines, such as Spark, improved iterative workloads and interactive analysis by reducing expensive disk round-trips.
Performance claims can be overstated, so we prefer grounded guidance: IBM notes Spark performance can be up to 100x faster than Hadoop for small workloads and typically only up to 3x faster for large ones, which aligns with the sober reality that tuning, data shape, and resource constraints often matter as much as the engine choice.
3. Streaming and pipelines: tools for filtering, aggregating, and analyzing data across platforms
Streaming systems provide the connective tissue between event producers and analytic consumers. They handle buffering, fan-out, and delivery semantics so that downstream services can process events without directly coupling to every upstream source.
Pipeline orchestration and transformation tooling then takes over: scheduling batch jobs, managing dependencies, and ensuring transformations run in the correct order. In our work, the best pipeline tool is the one that makes failure visible, retries safe, and lineage explainable to both engineers and analysts.
4. Analysis and BI: data mining, predictive analytics, AI and ML tooling, and data visualization platforms
Analysis and BI tooling spans a wide range: from SQL-based exploration to notebooks, model training frameworks, feature stores, and visualization platforms. The winning pattern we see is not “one tool to rule them all,” but a coherent workflow where each stage hands off cleanly to the next.
For BI, semantic consistency is critical. For machine learning, reproducibility and monitoring are critical. When those priorities are treated as engineering requirements—not optional polish—analytics moves from “interesting” to “operationally reliable.”
Benefits, challenges, and common applications of big data analytics
Big data analytics is a lever: it can amplify good strategy and disciplined execution, or it can amplify confusion. The difference comes down to whether teams treat analytics outputs as decision inputs with accountability, rather than as passive artifacts.
1. Key benefits: real-time intelligence, better decisions, cost efficiency, customer engagement, and risk management
Real-time intelligence helps teams respond to events while outcomes are still malleable. Better decisions emerge when metrics are trusted and timely, which reduces political debates over whose spreadsheet is “right.” Cost efficiency follows when operations teams can detect waste, predict demand, and tune capacity instead of reacting to surprises.
Customer engagement improves when personalization is grounded in behavior rather than assumptions. Risk management benefits when anomalies and policy violations surface quickly, allowing intervention before small issues become major losses or regulatory problems.
2. Common use cases: product development, personalization, supply chain optimization, pricing models, fraud prevention, and operations
In product development, event analytics reveals where users struggle, which features drive retention, and which workflows cause drop-off. Personalization uses behavioral signals to tailor recommendations, content ordering, or onboarding steps, as seen in many streaming and ecommerce experiences.
Supply chain optimization uses scan events, inventory states, and demand signals to reduce stockouts and delays. Fraud prevention and operations monitoring rely on anomaly detection and rule-based decisioning backed by scalable pipelines that can process high-volume events without excessive latency.
3. Industry applications: healthcare, retail, finance, transportation, agriculture, manufacturing, education, and insurance
Healthcare analytics can support capacity planning, clinical operations, and population insights—provided governance and patient privacy remain central. Retail uses clickstream and purchase behavior to improve merchandising and reduce returns. Finance applies analytics to risk scoring, transaction monitoring, and customer segmentation with heavy compliance constraints.
Transportation and logistics benefit from route optimization and asset monitoring. Agriculture increasingly relies on equipment telemetry, weather patterns, and yield signals to optimize inputs and timing. Manufacturing uses predictive maintenance and quality analytics, while education and insurance use analytics for engagement, retention, and operational risk—each domain with its own ethical boundaries.
4. Core challenges: data overload, data quality, privacy and security, accessibility, tool selection, and ongoing costs
Data overload is a quiet killer: teams collect more than they can interpret, then drown in dashboards that no one trusts. Data quality issues compound over time, especially when upstream systems change faster than downstream models can adapt. Privacy and security are perennial challenges because analytics platforms concentrate sensitive data, making them attractive targets and compliance liabilities.
Accessibility matters too. If only specialists can answer questions, analytics becomes a bottleneck rather than an enabler. Tool selection and ongoing costs then show up as the long tail of ownership: licensing, compute, storage, staffing, and the operational burden of keeping pipelines healthy.
5. Careers and skills: data analyst, data scientist, data engineer, machine learning engineer, BI analyst, data visualization specialist, and data architect
Big data programs succeed when roles are clear and collaboration is by design. Data analysts and BI analysts translate questions into metrics and reports. Data engineers build reliable pipelines and curated datasets. And data scientists explore patterns and develop models, while machine learning engineers run those models in production environments with monitoring and managed.
Data visualization specialists help teams communicate insight clearly, and data architects define the standards and structure that keep everything clear. In our view, the most necessary skill across all roles is not a specific tool; it is the ability to connect data work to decisions and outcomes.
How TechTide Solutions helps teams build custom big data analytics solutions
We build big data analytics systems the way we build software products: around users, workflows, and operational reality. Off-the-shelf platforms can be powerful, yet most organizations need integration, managed, and production hardening tailored to their specific data sources and decision loops.
1. Custom data pipelines and platform integration tailored to your data sources and workflows
Our work often starts with pipeline design: defining ingestion patterns, transformation layers, validation checks, and publishing contracts that downstream teams can trust. From there, we integrate the platform into the systems teams already live in—product event pipelines, operational databases, third-party services, and business applications.
Just as importantly, we help define “data as a product” expectations: ownership, documentation, SLAs, and change management. When pipeline behavior is predictable, teams can build analytics and automation on top without fearing that a quiet upstream change will rewrite reality overnight.
2. Analytics applications and dashboards that turn complex data into usable decisions
Dashboards are not the goal; decisions are the goal. We design analytics applications that fit how leaders and operators actually work: drill-down paths that mirror investigative thinking, metrics that map to accountable owners, and narrative views that explain what changed and why it matters.
In delivery, we emphasize semantic consistency and self-service exploration. When teams can answer questions without waiting on a specialist, analytics stops being a queue and starts being a capability embedded in day-to-day operations.
3. Operationalizing scalable analytics, machine learning, and real-time processing in production systems
Operationalizing analytics means building for failure, scale, and change. We implement monitoring, lineage, access controls, and deployment workflows so that pipelines and models can evolve safely. Real-time processing requires additional rigor: idempotent consumers, replay strategies, and state handling that remains correct under retries and partial outages.
From our perspective, the biggest difference between a demo and a durable system is operational empathy. If on-call engineers cannot diagnose issues quickly—and if business stakeholders cannot interpret outputs confidently—then the platform will eventually be sidelined, regardless of how impressive the initial model metrics looked.
Conclusion: moving from raw data to actionable insights with big data analytics
Big data analytics is ultimately a craft of translation: translating messy reality into reliable signals, and translating signals into decisions that improve outcomes. The technology stack matters, but the operating model matters more—clear definitions, trustworthy pipelines, and feedback loops that measure whether actions worked.
At TechTide Solutions, we’ve learned to treat analytics as a living system rather than a one-time implementation. Once data starts guiding decisions, the business will ask sharper questions, demand faster answers, and expect automation where manual review used to be “good enough.”
If your organization had a single analytics capability it could deploy next—one that would genuinely change how decisions get made—would you rather invest in faster reporting, deeper prediction, or tighter operational action when events occur?
